

A Restless Earth: Hazards in Focus
The Ocean Is Storing Heat: Why 2026 Could Bring One of the Strongest El Niños on Record
Corresponding author: Anastasiya Pashigreva, [email protected]
Weather agencies are warning that by winter the Pacific could unleash an extreme El Niño. Here is what the phenomenon is, why such events are intensifying, and what the last one, in 2023/24, resulted in.
Article
An Official Advisory
In the summer of 2026, the U.S. National Weather Service did something it does only rarely: it issued an official El Niño Advisory [1]. El Niño is developing in the tropical Pacific and, according to the forecast, “is predicted to intensify to a moderate or strong level this fall.” In its July 9, 2026, outlook, NOAA placed the probability of a “very strong” El Niño at its October–December peak at 81%, confirming expectations and pointing to one of the largest events since 1950 [2]. So what exactly is this phenomenon?
What El Niño Is
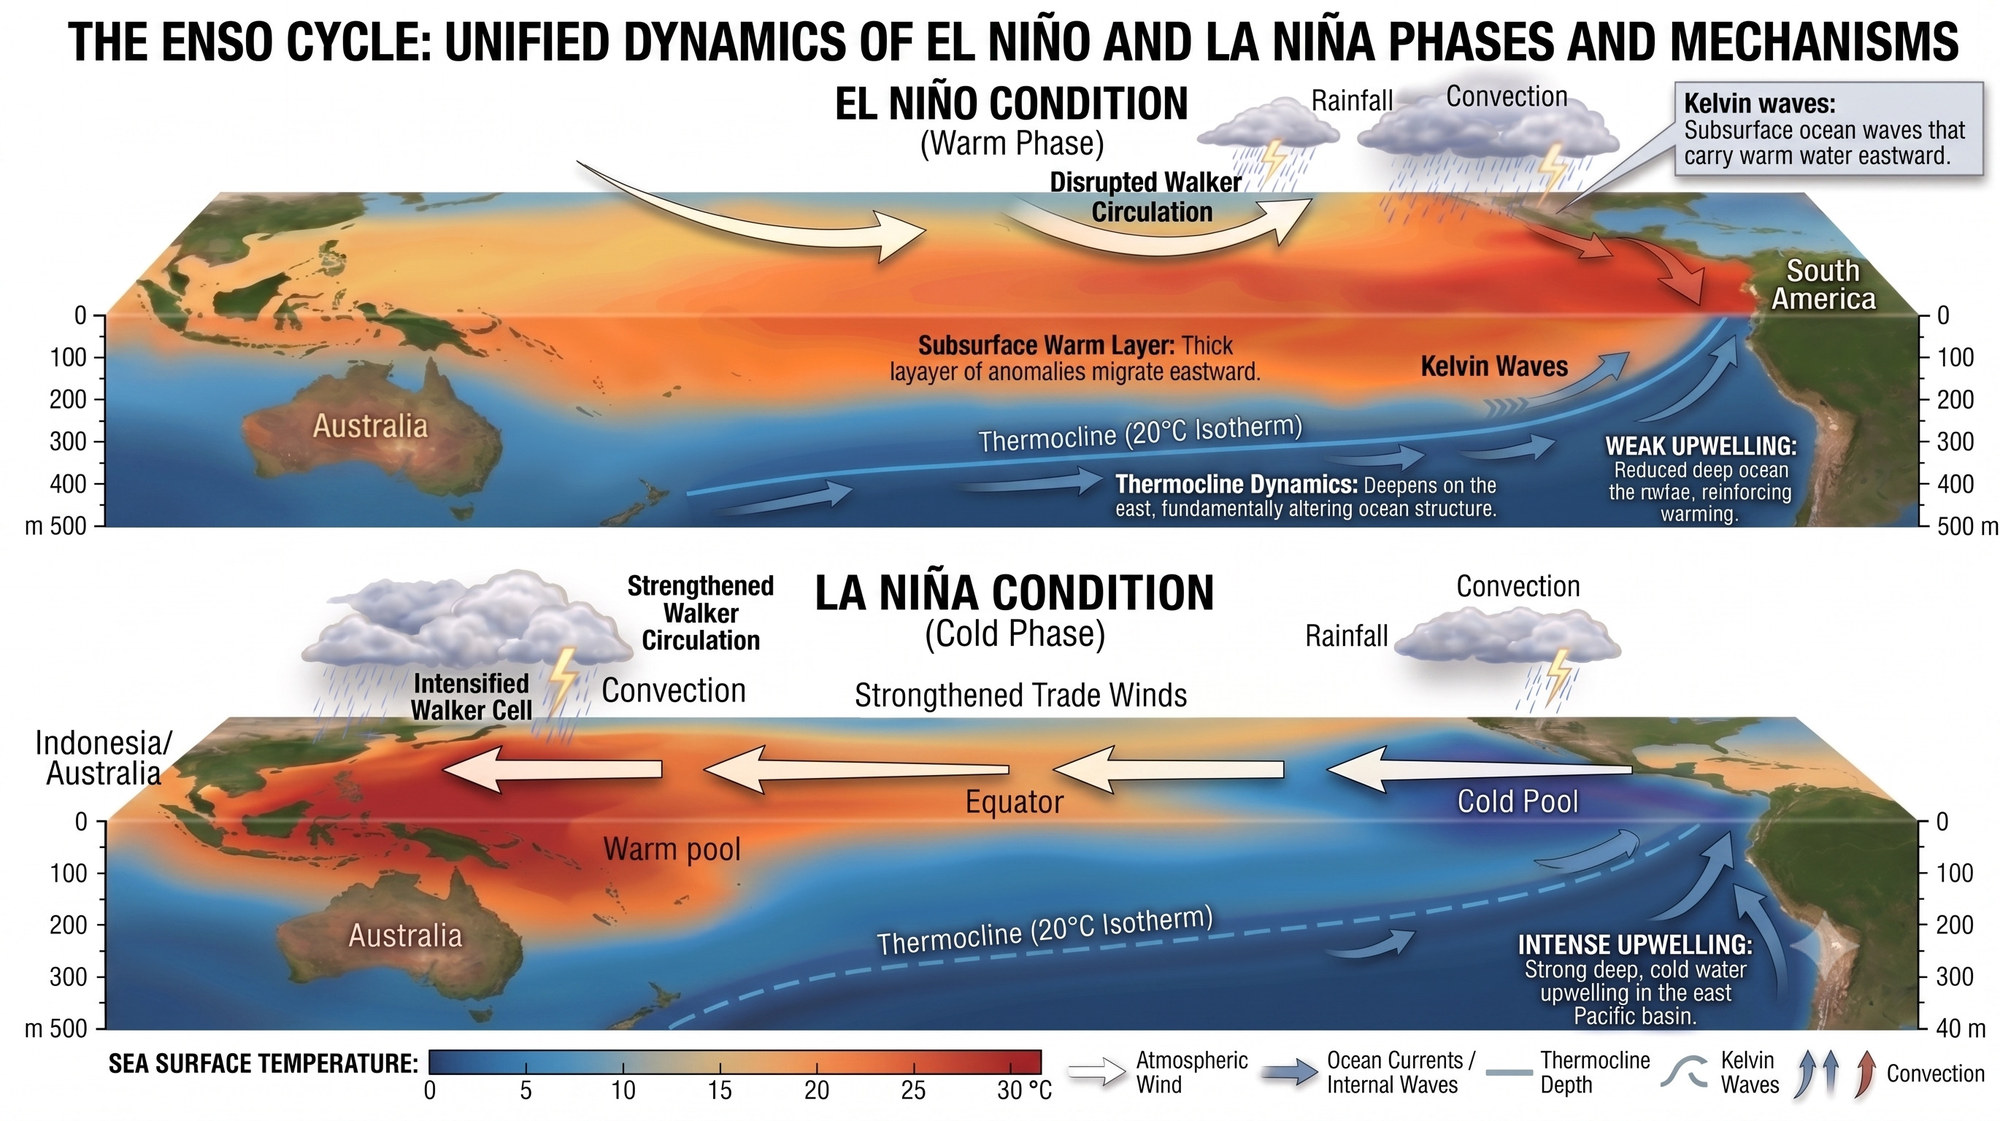
El Niño (Spanish for “boy”) is the warm phase of a large-scale climate “pendulum” in the Pacific that scientists call the El Niño–Southern Oscillation, or ENSO. In ordinary years, the trade winds drive sun-warmed water westward along the equator toward Indonesia, while off the coast of South America cold deep water rises to take its place—an upward motion known as upwelling. During El Niño the trade winds weaken, the warm water spreads back toward the east, and an enormous pool of anomalously warm water forms over the central and eastern equatorial Pacific. The opposite, cold phase is called La Niña (Spanish for “girl”): the trade winds strengthen, upwelling off South America intensifies, and the eastern Pacific becomes markedly cooler than usual. El Niño and La Niña are the two poles of this single “pendulum” oscillation.
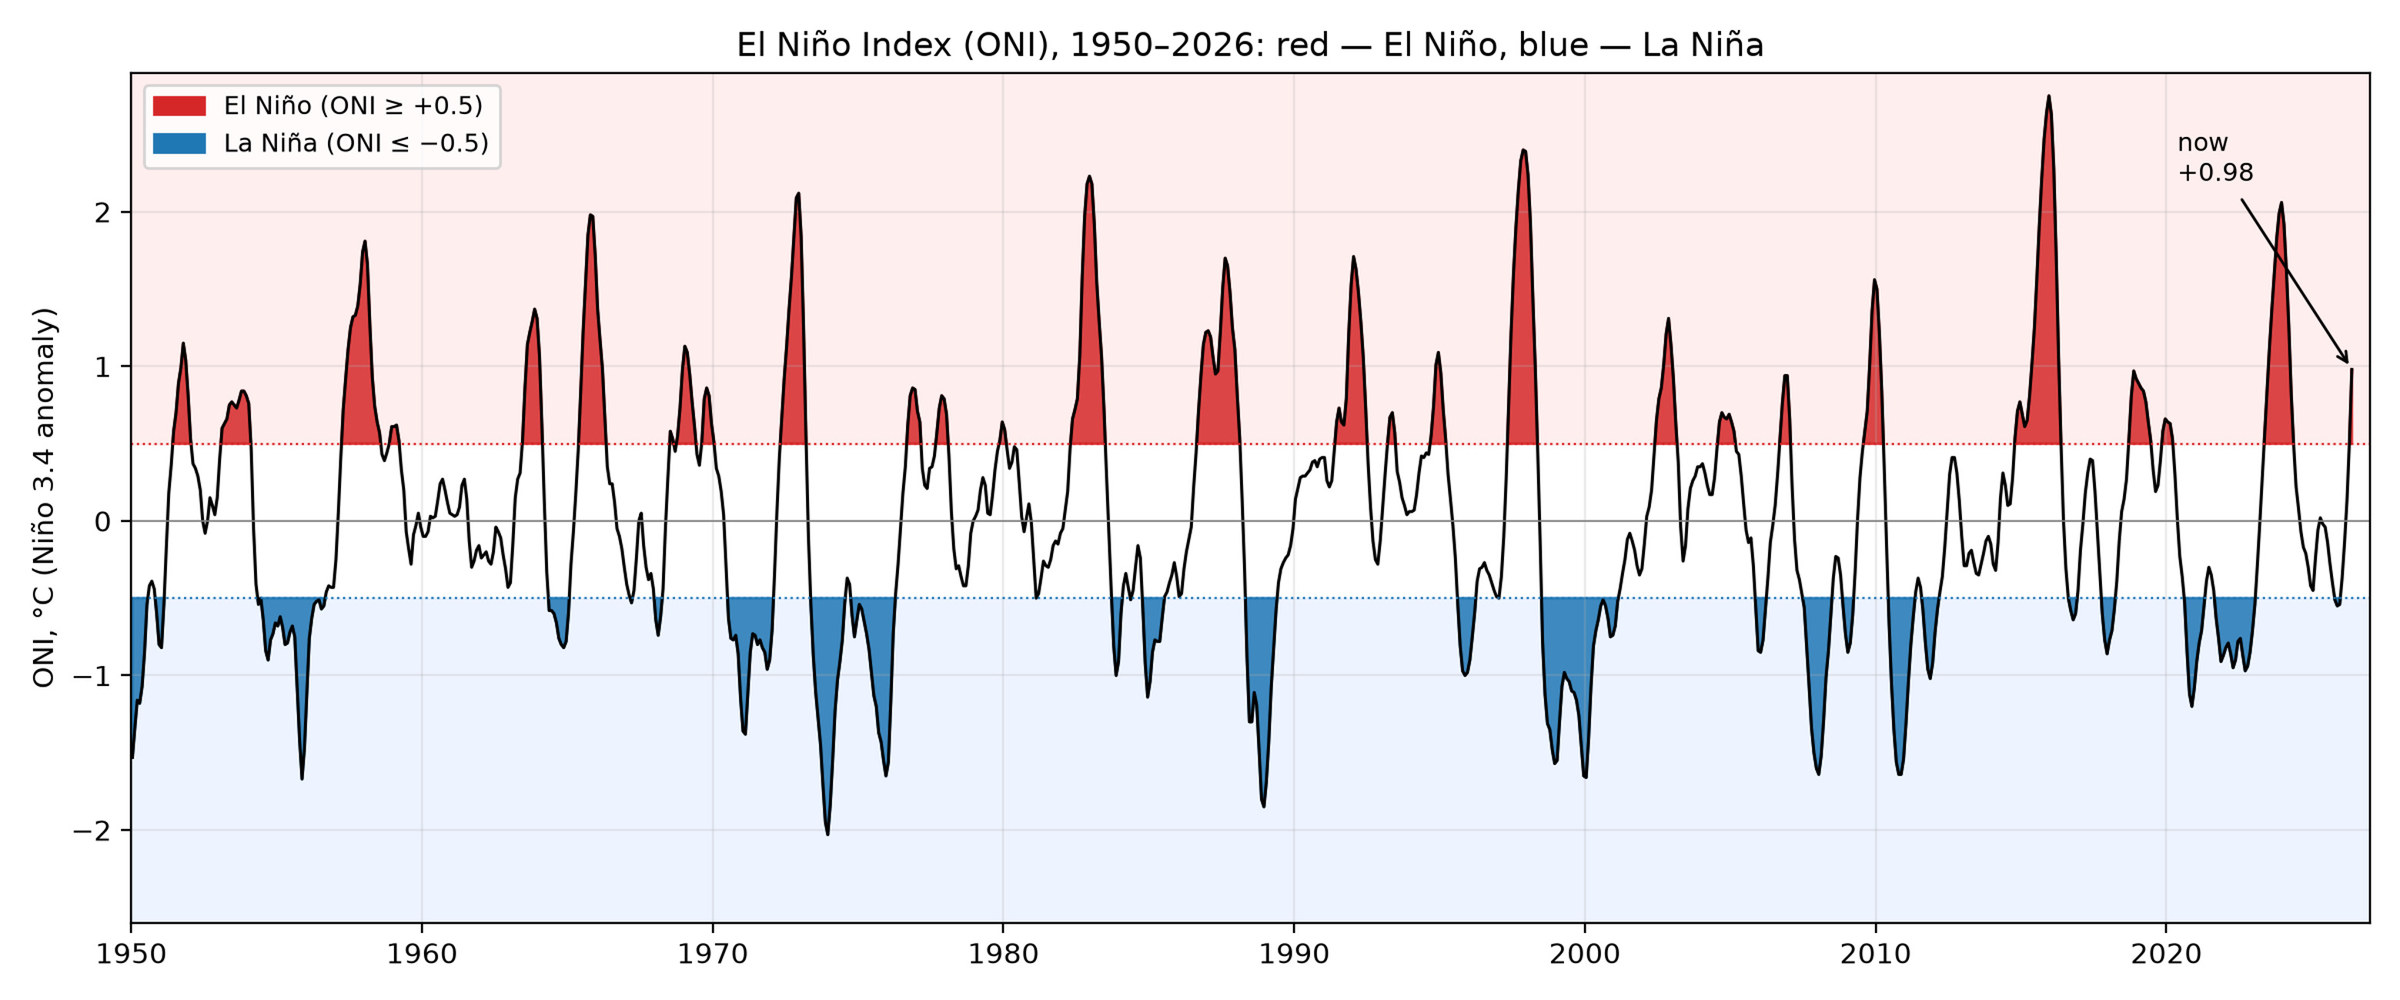
This regular alternation of warm and cold phases stands out clearly across the half-century record of the Oceanic Niño Index (ONI) [3] (Fig. 1). This index measures an event’s strength: it is the averaged departure of sea surface temperature in a reference region from the climatological norm. A value of +0.5 °C or higher signals El Niño, and the threshold for a “very strong” event is taken to be +2.0 °C.
In broad strokes, the mechanism of this “pendulum” works as follows. In neutral years the trade winds push warm water toward the western Pacific. When the trade winds weaken or briefly reverse (episodes called westerly wind bursts), a slow internal wave known as a Kelvin wave begins to travel eastward across the ocean. It deepens the thermocline, the thin boundary between the warm surface layer and cold deep water, and off the coast of South America the cold water stops rising to the surface. The warm water spreads eastward and reaches the surface, and the zone of heavy thunderstorms shifts along with it. The more heat stored beneath the surface and the farther east it travels, the stronger the event. This is how every El Niño works; in strong years, such as the current one, what is unusual is not the mechanics themselves but the scale of the subsurface anomaly and how far east the region of extreme warmth reaches. That is why it is necessary to examine not only the ocean surface but also the heat stored at depth (Fig. 2).
The event may seem local, yet its consequences are global. The zone of powerful tropical convection moves eastward with the warm water. These are the same heavy thunderstorms that transfer colossal amounts of energy into the atmosphere. When the convection shifts, jet streams reorganize across the planet, changing weather patterns: droughts arrive in some places, floods in others. That is precisely why El Niño is felt on every continent, and not only off the coast of Peru.
Why the Current El Niño Could Become So Strong
The extent of the current El Niño will become clear by autumn. But the initial conditions are already unusual, and here is why. First, a strong event is forming only two years after the previous extreme El Niño of 2023/24 and immediately following the rare “triple” La Niña of 2020–2023, when the cold phase of ENSO persisted for three winters in a row instead of the usual one or two [3] (Fig. 3). The ocean swung from the cold phase into the warm one unusually fast. Second, this time, international models are unusually consistent in indicating that the event will be at least strong.
Climatologist Daniel Swain, author of the popular science blog Weather West, gave his June 11, 2026, analysis the blunt title: “Rising odds of a strong-to-historic El Niño event in 2026.” In his words, the latest results from international model ensembles are “depicting at least a ‘strong’ event, and the majority indicating a top-tier, very strong-to-historic event” [4]. In other words, this is not an ordinary fluctuation but a potentially record-setting phenomenon.
It is the combination of the rapid transition between El Niño and La Niña and the consistency of model forecasts that is raising concern among meteorologists.
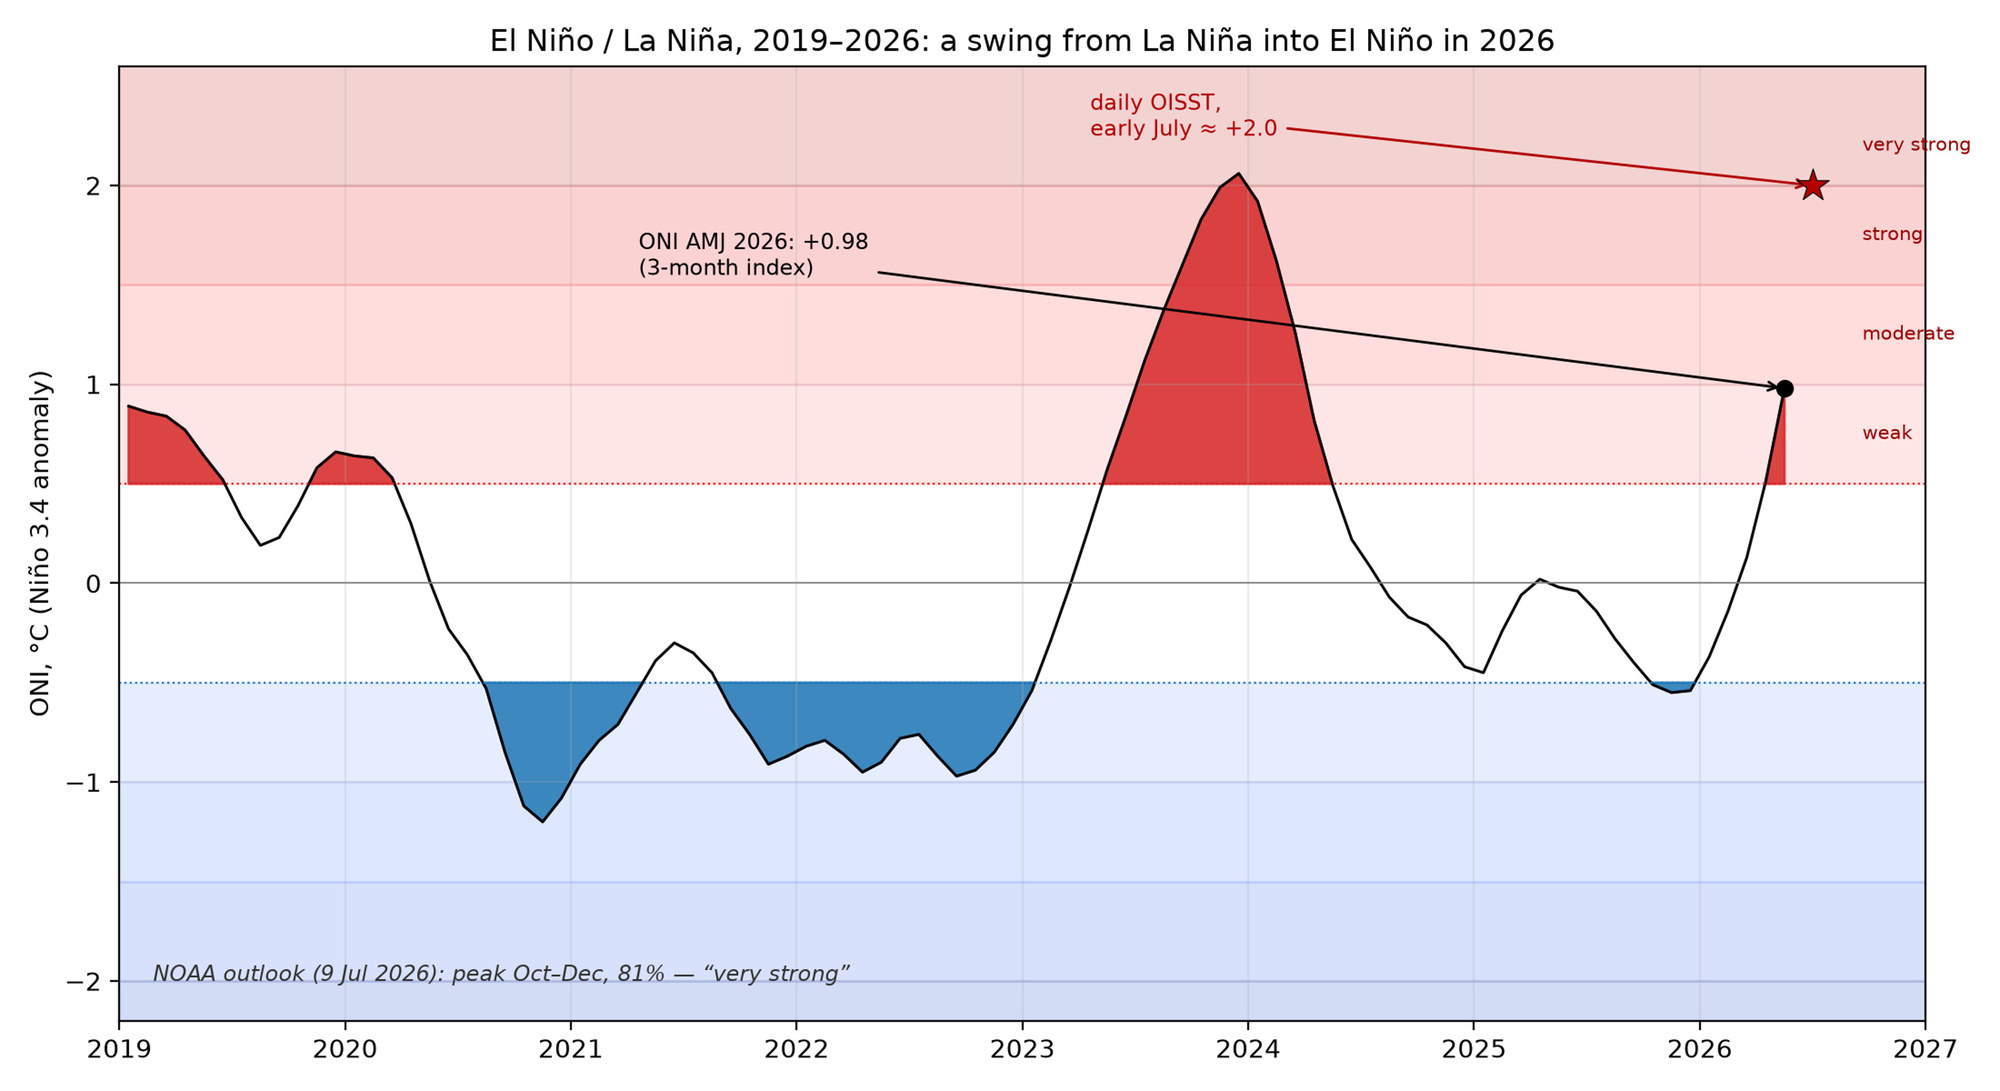
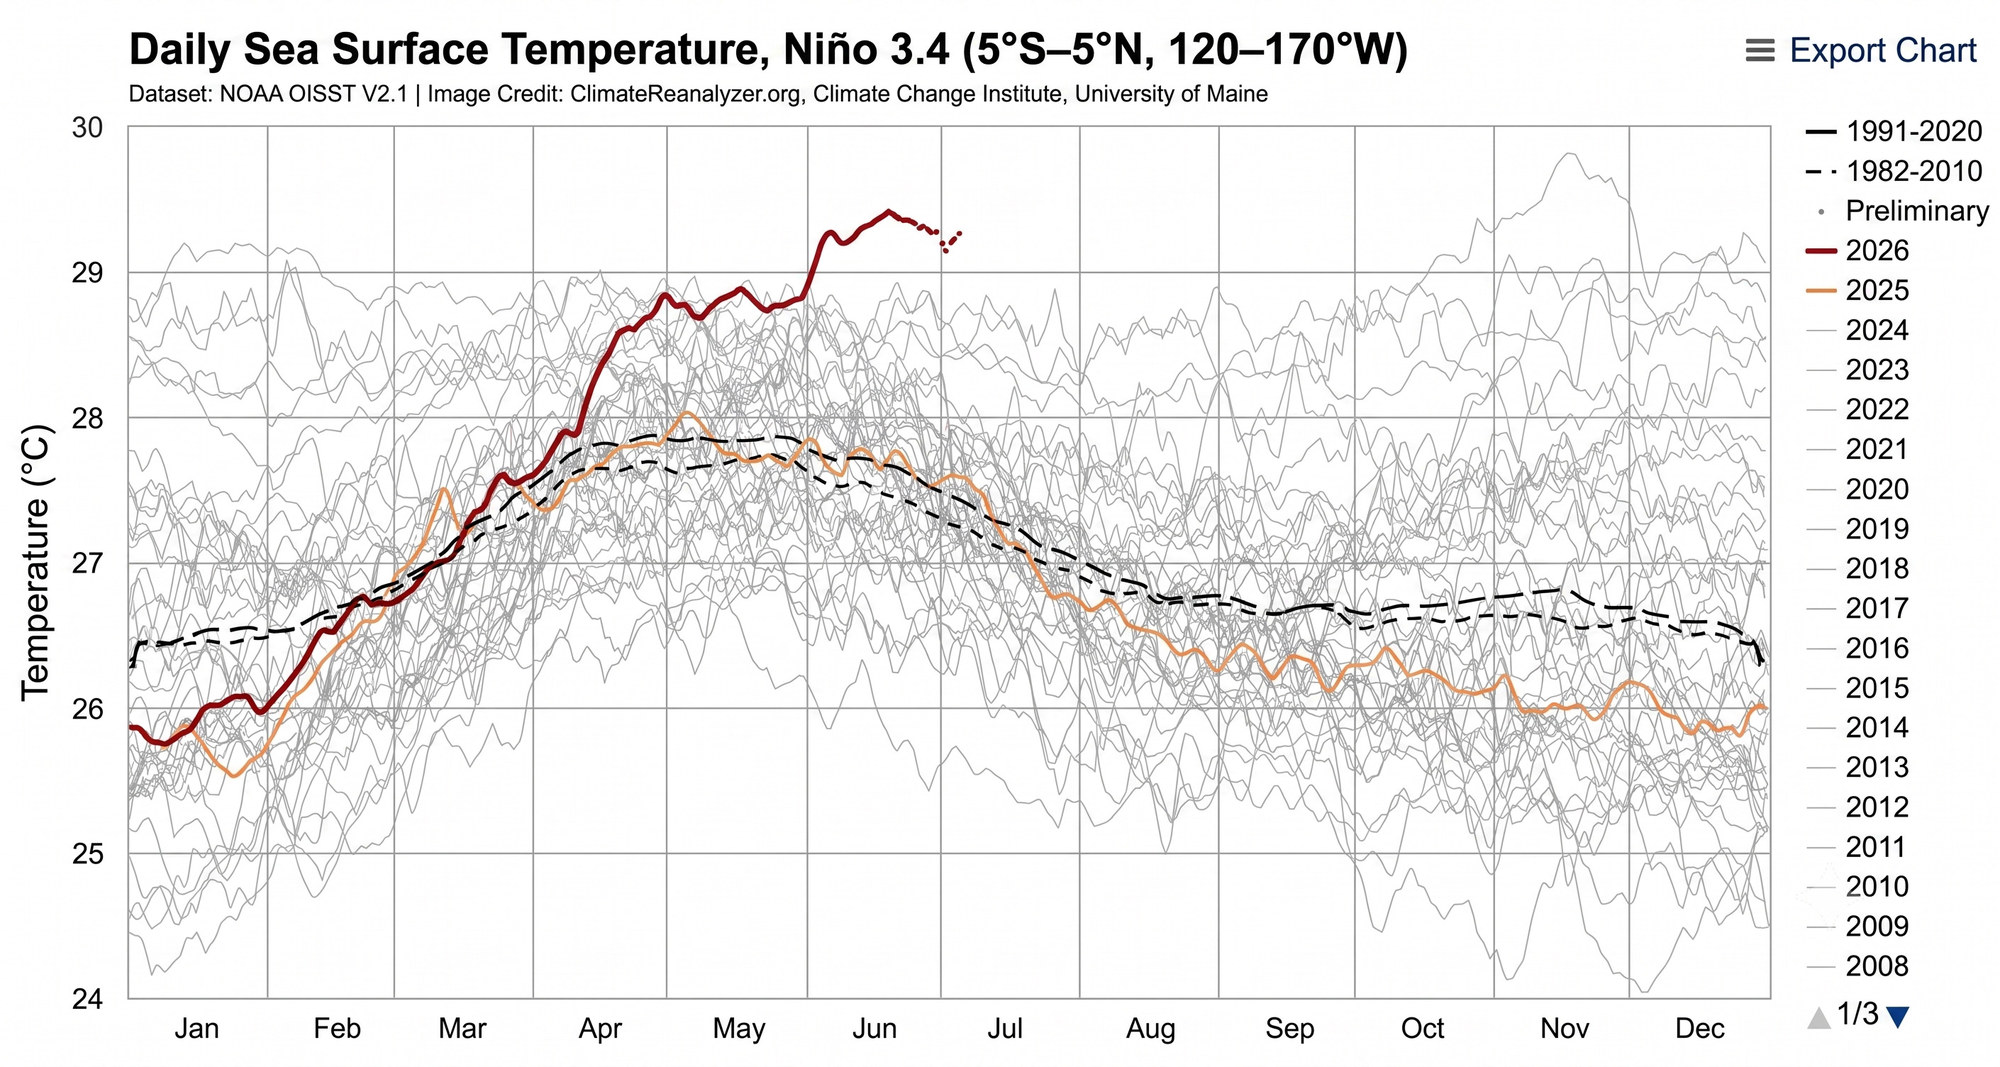
Early observations are already confirming these concerns. On individual days in early July 2026, the daily temperature anomaly in the Niño-3.4 region, according to OISSTv2.1 data, approached +2.0 °C. This had never happened so early in the satellite era: even in the powerful year of 1997 the anomaly held at only about +1.0 °C by early July, and that El Niño did not reach the +2.0 °C threshold until September. In terms of its strength this early in the year, the present warming is unprecedented; the central Pacific is now warmer than has ever been observed for this time of year. Here it is worth distinguishing between metrics. The official ONI index, averaged over three months, remains at the threshold of the moderate category (+0.98 °C, the upper bound of the weak El Niño category), while NOAA forecasters place the “very strong” event threshold of +2.0 °C at the winter peak, so July values above +2.0 °C reflect daily spikes rather than a seasonal category. Even so, the changes are visible to the naked eye: the cold tongue off the coast of South America has almost disappeared, and the pool of water warmer than 30 °C has migrated eastward of the International Date Line, consistent with observations by Eric Webb and Paul Roundy [5]. On the graph itself this is immediately apparent: the bold 2026 line runs above the cloud of prior years for almost the entire season and stays near its upper edge, whereas in ordinary years the water is already noticeably cooler by July (Fig. 4).
But the most important thing is unfolding beneath the ocean surface. Westerly wind bursts have generated a Kelvin wave, which has already pushed an enormous reservoir of warm water with anomalies of four to six degrees beneath the thermocline; a volume this large, lying this deep, has not been seen in several decades [2]. For now this heat is accumulating at depth in the eastern Pacific, and as it rises toward the surface, it feeds the strengthening El Niño.
Why Extreme El Niños Are Intensifying
El Niños occur on average once every three to four years. Over the past two decades, however, the character of El Niño events has begun to change: the most powerful, “extreme” events are becoming stronger. Our analysis of the official ONI record since 1950 [3] shows that the five strongest El Niños in the entire instrumental record, with peaks above +2.0 °C, are 1972/73, 1982/83, 1997/98, 2015/16, and 2023/24. Four of these five occurred within the last forty-odd years, and the two most intense of the entire record, 1997/98 and 2015/16, occurred during the era of pronounced global warming (Fig. 5).
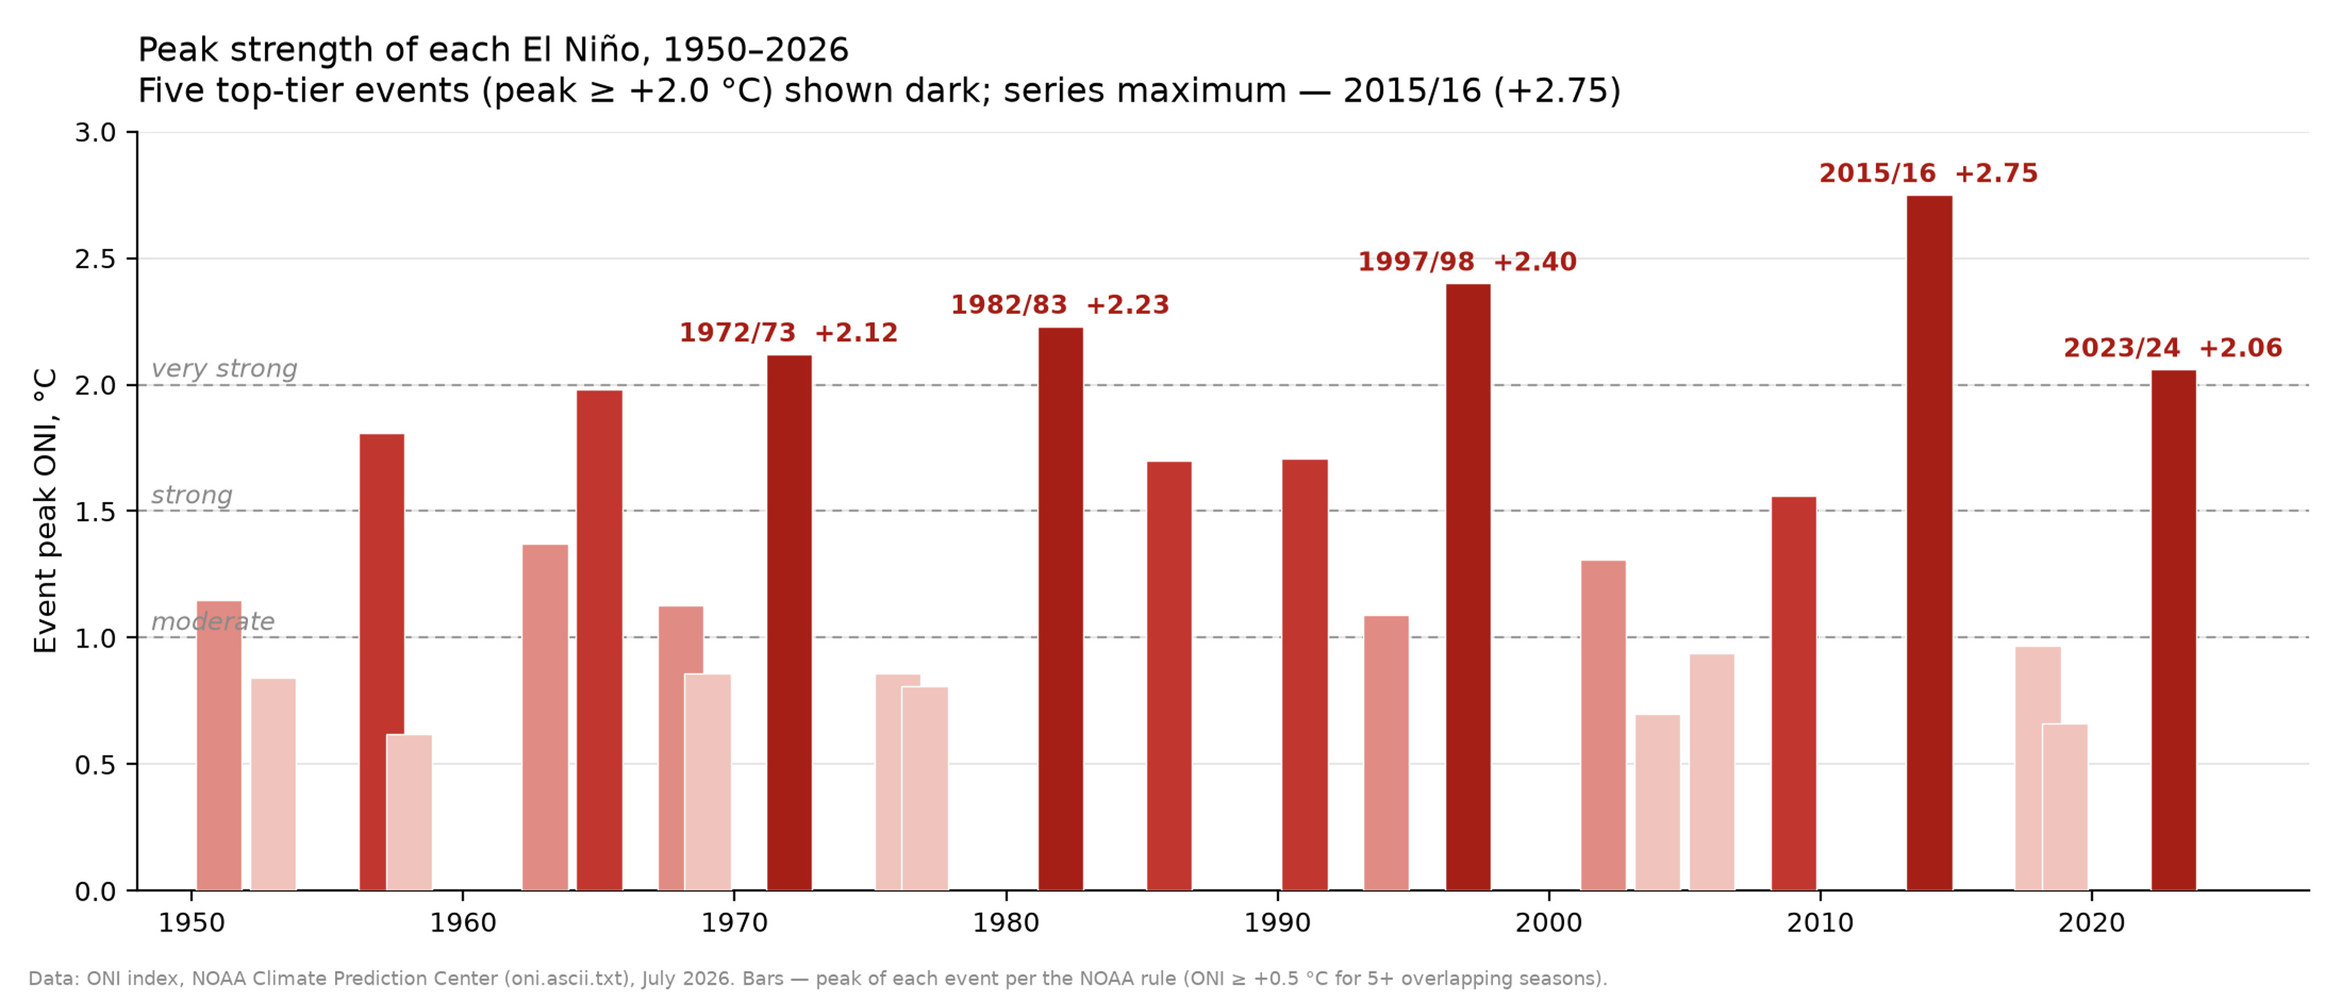
This is not only an observed pattern but also a theoretical projection. In 2014, Nature Climate Change published what has since become a landmark paper by Wenju Cai, a chief research scientist at CSIRO, and colleagues. The study concludes that the frequency of extreme El Niños will be “doubling in the occurrences in the future in response to greenhouse warming.” The mechanism is not straightforward. It is not simply a matter of uniform warming, but of the fact that the eastern equatorial Pacific, according to model projections, warms faster than the surrounding waters, and this makes it easier to trigger that same powerful convection in the normally cold and dry eastern sector [6]. Put simply, a warmer ocean more readily “flips” into the extreme regime.
There is yet another reason today’s extremes are breaking records: the current El Niño is unfolding against the backdrop of an already warmer ocean, whose heat content breaks records year after year (Fig. 6).
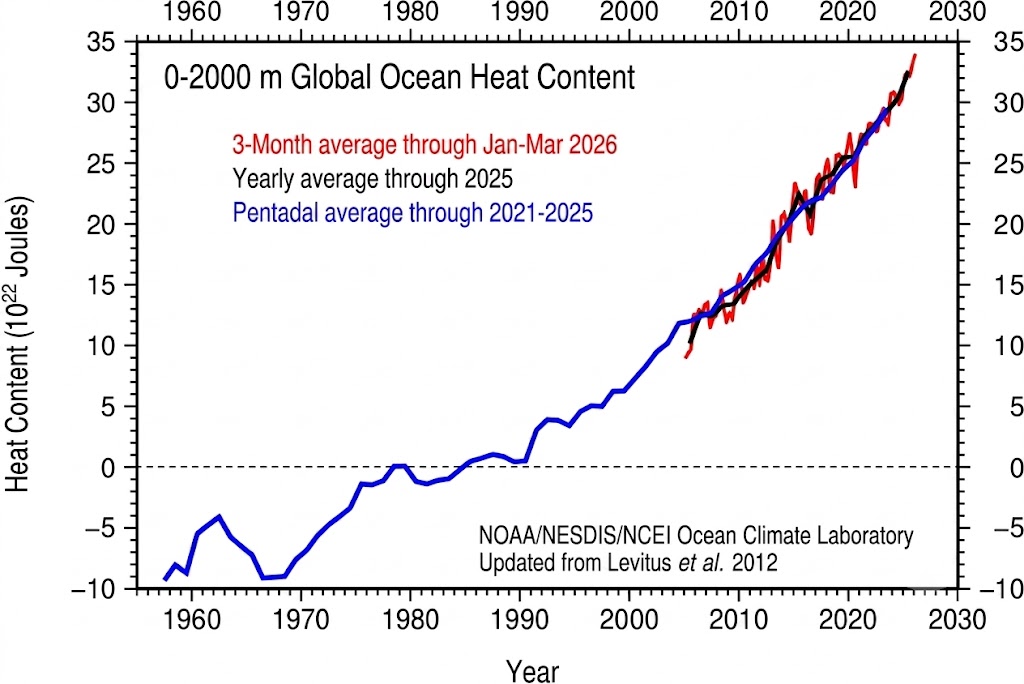
The same +2.5 °C anomaly in 2026 means a higher absolute water temperature than the same anomaly in 1998, because it is superimposed on a warmer baseline than existed during the 1997/98 and 2015/16 events. By the estimate of the mathematician and climate analyst Eliot Jacobson, by July 2026 the sea surface temperature anomaly in the Niño-3.4 region had reached approximately 3.6 standard deviations above the 1991–2020 baseline—a magnitude virtually unattainable without greenhouse warming [7]. Here it's important to clearly distinguish between two metrics. The ONI index measures deviation from the norm, but the norm itself is rising year after year, so the same deviation today means warmer water than it did before. What is more, raising an already-warm ocean by the same number of degrees takes more energy, and warmer water gives that heat back to the atmosphere faster. As a result, an event with a formally more modest ONI peak — 2023/24 compared with 2015/16, for instance — can carry more energy than the index alone suggests.
A caveat about the indices is warranted. For this reason, in February 2026, NOAA shifted its official ENSO monitoring to a new index—RONI (the Relative Oceanic Niño Index) [8]: it subtracts the ocean’s background warming from the measured temperature and therefore compares the strength of events from different decades more fairly. All the graphs in this article are built on the classic ONI, used consistently across the entire record since 1950; at the same time, NOAA’s recent forecast of an 81% probability is already tied to the thresholds of the new index [9].
What the Last Extreme El Niño, 2023/24, Set in Motion
The significance of the current situation becomes clear when compared with the previous major El Niño event. The El Niño of 2023/24 was superimposed on long-term warming, resulting in record-breaking conditions. The Copernicus Climate Change Service (C3S) confirmed this: “2024 is confirmed by the Copernicus Climate Change Service (C3S) to be the warmest year on record globally, and the first calendar year that the average global temperature exceeded 1.5°C above its pre-industrial level” [10]. The World Meteorological Organization estimated the anomaly at about 1.55 °C [11]. Scientists emphasize that the primary driver was human-induced climate change, while El Niño temporarily amplified the warming and helped push temperatures to record levels against the background of the long-term trend [10]
These temperature records had tangible consequences. At the peak of the 2023/24 warmth, the fourth global coral bleaching event on record unfolded, and NOAA officially announced widespread bleaching across the planet’s reefs [12]. By the time the event was declared over in 2025, bleaching-level heat stress had affected 84% of the world’s coral reef area, across reefs in all three ocean basins that contain coral [13]. Bleaching happens when an overheated coral expels the algae living within it and, deprived of nourishment, risks dying.
But reef bleaching was only one of the consequences. In the Amazon, a prolonged drought led to record-low river levels: in October 2024, the level of the Rio Negro at Manaus fell to its lowest mark since measurements began in 1902, severely disrupting navigation on the Amazon’s tributaries [14]. In southern Africa, the drought took on the scale of a humanitarian disaster: Zambia, Zimbabwe, and Malawi declared national emergencies, and tens of millions of people were at risk of food shortages [15]. In Canada, the 2023 wildfire season was record-breaking: according to a revised satellite estimate, the fires covered about 15 million hectares, more than double the previous maximum, set in 1989 [16]. The risk of such extreme events remains in 2026, as international meteorological organizations warn [17].
What El Niño Does Not Explain
But the story of 2023/24 has a second, far more mysterious side. The warmth of those years exceeded even what scientists expected after accounting for both the approaching El Niño and long-term warming. The climatologist Gavin Schmidt, director of the Goddard Institute for Space Studies (NASA GISS), stated this directly in the subtitle of a March 2024 article in Nature: “Taking into account all known factors, the planet warmed 0.2 °C more last year than climate scientists expected.” In the article itself, he wrote: “It’s humbling, and a bit worrying, to admit that no year has confounded climate scientists’ predictive capabilities more than 2023 has” [18].
Later, Schmidt spoke even more candidly: “Warming in 2023 was head-and-shoulders above any other year, and 2024 will be as well. … I wish I knew why, but I don’t. We’re still in the process of assessing what happened and if we are seeing a shift in how the climate system operates” [19]. For a field grounded in predictive modeling, such an acknowledgment is especially significant.
The issue is not limited to El Niño or the tropical Pacific. John Abraham, a professor at the University of St. Thomas who studies ocean temperature, put it this way: “I do fear there may be something else going on that is causing a long-term change in sea surface temperatures we hadn’t predicted” [20]. Record heat was observed far from El Niño’s usual “domain”: in the North Atlantic, the North Pacific, the Southern Ocean, and the Indian Ocean—and in different basins at different times. In the North Atlantic, the records began as early as March 2023, before the peak of El Niño, while the Niño-3 and Niño-3.4 indices themselves were not record-setting at all in 2023, even though global ocean temperature was breaking records [21-23].
Simple arithmetic shows the size of the gap. In the WMO report “State of the Global Climate 2024,” Schmidt and climatologist Zeke Hausfather prepared a special assessment. They quantified the known external factors for 2023: the contribution of El Niño of about +0.01 °C, the shift to cleaner shipping fuel (that is, fewer reflective sulfates) of 0.03 to 0.08 °C, the eruption of Hunga Tonga of about −0.02 °C, and a small solar contribution. Even together, these standard factors still do not fully account for the anomaly [18, 24]. This indicates that part of the signal remains unexplained.
The leading candidate today for this missing link is the planet’s reflectivity. Goessling and colleagues show that the known drivers, including ongoing warming and the onset of El Niño, cannot fully explain the jump of about 0.2 K, and identify record-low planetary albedo, driven primarily by a decrease in low cloud cover, as the factor that closes the gap [25]. But both the authors of that work and the authors of the “multi-basin” studies acknowledge the same limitation: a complete attribution has not yet been established.
Therefore, this gap in understanding is real, and leading climatologists themselves acknowledge it. Understanding what made 2023 a year of “El Niño plus something else,” beyond both El Niño itself and the known factors, is today one of the most pressing open questions in climate science. As for the 2026 El Niño, NOAA forecasts its peak for autumn and early winter, and we will see whether the “very strong” scenario is borne out. We will return to this question when the ocean has its say.
About the authors

References
- National Oceanic and Atmospheric Administration. “El Niño Forms, Expected to Strengthen, Say NOAA Forecasters.” 2026. https://www.noaa.gov/news-release/el-nino-forms-expected-to-strengthen-say-noaa-forecasters
- NOAA Climate Prediction Center. “ENSO Diagnostic Discussion.” July 9, 2026. https://www.cpc.ncep.noaa.gov/products/analysis_monitoring/enso_advisory/
- NOAA Climate Prediction Center. Oceanic Niño Index (ONI). Accessed July 2, 2026. https://www.cpc.ncep.noaa.gov/data/indices/oni.ascii.txt
- Swain D. “Special Update: Rising Odds of a Strong-to-Historic El Niño Event in 2026.” Weather West, June 11, 2026. https://weatherwest.com/archives/43880
- Climate Reanalyzer, Climate Change Institute, University of Maine. Daily Sea Surface Temperature and Anomalies in the Niño-3.4 Region. NOAA OISST v2.1. Accessed June 15, 2026. https://climatereanalyzer.org/clim/sst_daily/
- Cai W., Borlace S., Lengaigne M., et al. “Increasing Frequency of Extreme El Niño Events Due to Greenhouse Warming.” Nature Climate Change 4 (2014): 111–116. https://doi.org/10.1038/nclimate2100
- Jacobson E. “Some Monsters Are Real.” Climate Casino, July 8, 2026. https://climatecasino.substack.com/p/some-monsters-are-real
- NOAA Climate Prediction Center. “CPC Adopts Relative Oceanic Niño Index (RONI) for Reliable, Responsive Monitoring and Tracking of ENSO.” February 2026. https://www.cpc.ncep.noaa.gov/products/analysis_monitoring/enso/roni/announcement.php
- NOAA Climate Prediction Center. Relative Oceanic Niño Index (RONI). Accessed July 2, 2026. https://www.cpc.ncep.noaa.gov/data/indices/RONI.ascii.txt
- Copernicus Climate Change Service. “Copernicus: 2024 Is the First Year to Exceed 1.5 °C above Pre-industrial Level.” January 10, 2025. https://climate.copernicus.eu/copernicus-2024-first-year-exceed-15degc-above-pre-industrial-level
- World Meteorological Organization. “WMO Confirms 2024 as Warmest Year on Record at about 1.55 °C above Pre-industrial Level.” January 10, 2025. https://wmo.int/news/media-centre/wmo-confirms-2024-warmest-year-record-about-155degc-above-pre-industrial-level
- National Oceanic and Atmospheric Administration. “NOAA Confirms Fourth Global Coral Bleaching Event.” April 15, 2024. https://www.noaa.gov/news-release/noaa-confirms-4th-global-coral-bleaching-event
- NOAA National Environmental Satellite, Data, and Information Service. “World’s Fourth Mass Coral Bleaching Event Likely Ended in 2025.” June 2, 2026. https://www.nesdis.noaa.gov/news/worlds-fourth-mass-coral-bleaching-event-likely-ended-2025
- Al Jazeera. “Water Levels in Major Amazon Tributary Tumble to Record Lows amid Drought.” October 5, 2024. https://www.aljazeera.com/gallery/2024/10/5/water-levels-in-major-amazon-tributary-tumble-to-record-lows-amid-drought
- United Nations Office for the Coordination of Humanitarian Affairs. Southern Africa El Niño Regional Humanitarian Overview. UNOCHA, September 20, 2024. https://www.unocha.org/publications/report/mozambique/southern-africa-el-nino-regional-humanitarian-overview-september-2024
- Jain P., Barber Q. E., Taylor S. W., et al. “Drivers and Impacts of the Record-Breaking 2023 Wildfire Season in Canada.” Nature Communications 15 (2024): 6764. https://doi.org/10.1038/s41467-024-51154-7
- World Meteorological Organization. “El Niño Is Forecast to Intensify.” July 3, 2026. https://wmo.int/news/media-centre/el-nino-forecast-intensify-increasing-likelihood-of-extreme-weather
- Schmidt G. “Climate Models Can’t Explain 2023’s Huge Heat Anomaly — We Could Be in Uncharted Territory.” Nature 627 (2024): 467. https://doi.org/10.1038/d41586-024-00816-z
- NASA Earth Observatory. “Charting the Exceptional, Unexpected Heat of 2023 and 2024.” NASA Science, November 20, 2024. https://science.nasa.gov/earth/earth-observatory/charting-the-exceptional-unexpected-heat-of-2023-and-2024-153588/
- NBC News. “The Oceans Have Been Hotter Than Ever….” March 15, 2024. https://www.nbcnews.com/science/environment/oceans-record-hot-rcna143179
- Minobe S., Behrens E., Findell K. L., et al. “Global and Regional Drivers for Exceptional Climate Extremes in 2023–2024: Beyond the New Normal.” npj Climate and Atmospheric Science 8 (2025): 138. https://doi.org/10.1038/s41612-025-00996-z
- Huang B., Yin X., Carton J. A., et al. “Record High Sea Surface Temperatures in 2023.” Geophysical Research Letters 51 (2024): e2024GL108369. https://doi.org/10.1029/2024GL108369
- Kuhlbrodt T., Swaminathan R., Ceppi P., et al. “A Glimpse into the Future: The 2023 Ocean Temperature and Sea Ice Extremes in the Context of Longer-Term Climate Change.” Bulletin of the American Meteorological Society 105 (2024): E474–E485. https://doi.org/10.1175/BAMS-D-23-0209.1
- World Meteorological Organization. State of the Global Climate 2024. WMO-No. 1368. World Meteorological Organization, 2025. https://wmo.int/sites/default/files/2025-03/WMO-1368-2024_en.pdf
- Goessling H. F., Rackow T., Jung T. “Recent Global Temperature Surge Intensified by Record-Low Planetary Albedo.” Science 387 (2025): 68–73. https://doi.org/10.1126/science.adq7280
© 2026 Anastasiya Pashigreva. This article is published under a Creative Commons Attribution 4.0 International licence (CC BY 4.0) unless a different licence is stated in the credit line of an individual item. The authors retain copyright; ALLATRA Natural Science Review holds the right of first publication. The Review charges no submission, publication, or article processing fees. © 2026 ALLATRA Inc.