

A Restless Earth: Hazards in Focus
Kamchatka’s 2025 Mega-Earthquake in Global Context
Corresponding author: N. Albridge, [email protected]
One of the ten strongest earthquakes in the history of instrumental observation occurred on the same fault segment as the giant 1952 event, and its aftershock sequence proved to be among the most prolific of the great megathrust earthquakes of the modern era. A numerical analysis can determine just how anomalous this sequence was.
Article
On July 29, 2025, the seafloor off the eastern coast of the Kamchatka Peninsula shifted by more than nine meters, releasing one of the largest known pulses of seismic energy. The earthquake reached a moment magnitude (Mw) of 8.8, placing it among the ten strongest instrumentally recorded events in history and matching the scale of the great 2010 Chile earthquake [1]. The Kamchatka earthquake generated a relatively small tsunami that spread across the Pacific Ocean and briefly activated several Kamchatka volcanoes [2, 3]. However, the most remarkable feature of this event lies not so much in its absolute power as in the intensity and unusual temporal pattern with which the Earth’s crust continued to move in the following months.
In September 2025, a month and a half after the mainshock, two major aftershocks occurred within the rupture zone: Mw 7.4 on September 13 and Mw 7.8 on September 18. This delayed reactivation shows that the period of elevated seismic hazard was not limited to the first days after the main event. This has direct practical implications for coastal populations: an unusually prolonged and active sequence means that the threat of strong earthquakes and tsunamis may persist not for days, but for months.
Kamchatka lies along one of the most active tectonic boundaries on the planet. Here, the Pacific Plate meets the Okhotsk Plate along a megathrust, an extensive contact between two plates where the world’s largest earthquakes occur [4]. Failure along such an interface ruptures segments hundreds of kilometers long, displaces the seafloor vertically by several meters, and radiates seismic waves that are recorded across the planet. On November 4, 1952, this same boundary produced the great magnitude 9.0 Kamchatka earthquake (Fig. 1) [5]. The resulting North Kuril tsunami reached heights of up to eighteen meters along the coast and traveled across the entire Pacific Ocean [6].
The 2025 rupture propagated unilaterally. It began near the hypocenter and spread southwestward along the Kuril–Kamchatka Trench, encompassing a segment several hundred kilometers long [3]. According to geodetic and seismological models, most of the slip was concentrated at depths of approximately 15 to 30 kilometers, where it reached about ten meters, while the rupture extended to the trench only in limited areas [7]. This distribution explains the moderate scale of the local tsunami. Runup heights along the southeastern coast of Kamchatka and the northern Kuril Islands were predominantly between 5 and 10 meters, reaching 10–16 meters only along a 100-kilometer stretch near Vestnik Bay and on Paramushir Island [8]. Thus, despite a magnitude comparable to that of the 1952 event, vertical seafloor displacement in shallow waters was substantially smaller, resulting in a weaker wave at the coast.
The 2025 Kamchatka event also has another, more profound distinguishing feature. Kamchatka is one of the few regions in the world where the largest earthquakes have long been considered within the framework of an official long-term seismic forecast [9]. The eventual occurrence of an extremely powerful event in this region was generally consistent with those expectations, but its timing was unexpected. The 2025 rupture occurred on the same fault segment as the 1952 event, only seventy-three years later. For megathrusts of this scale, this is an unusually short interval. According to the classical understanding, they release accumulated stress at intervals of centuries.
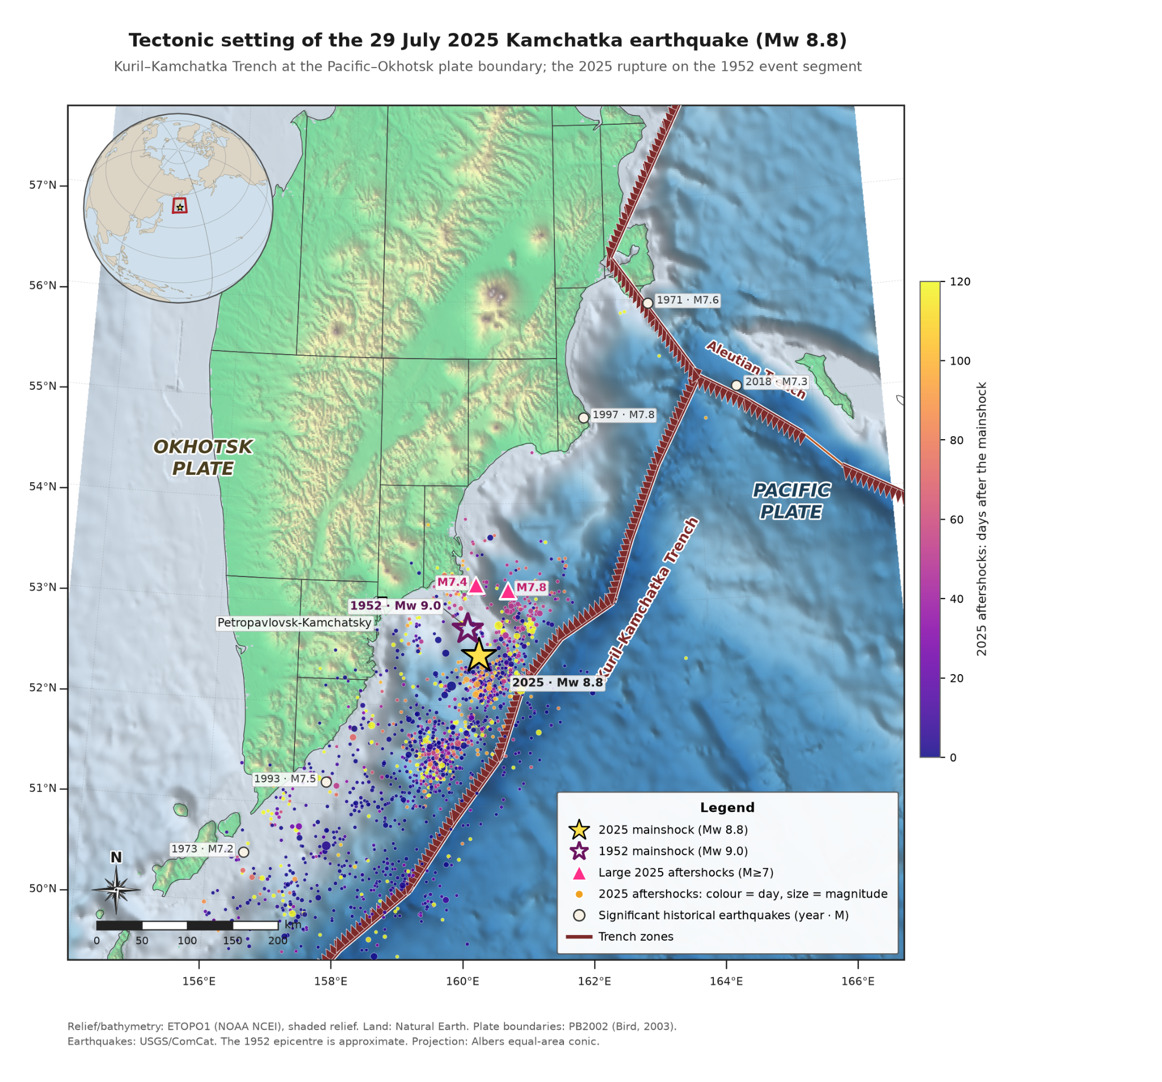
To determine whether the 2025 sequence truly stands out, it must be compared not only with the region’s own past but also with the entire family of great megathrust earthquakes recorded worldwide during the modern era of comprehensive catalog coverage. Such a comparison under equivalent conditions is the focus of this analysis. The key step is to define the boundaries of the analysis carefully. For each event, a rectangular geographic window is selected and scaled to the rupture length using the empirical Wells and Coppersmith relationship [12]. The larger the earthquake, the larger the window. For events with magnitudes around 8.8, including those in Kamchatka and Chile, the window is approximately 600 kilometers. This relationship was derived from continental earthquakes and provides only an approximate scale for megathrust events. However, because it is applied uniformly to all events, the comparison remains valid. The window is selected to capture the aftershocks of the main rupture while excluding unrelated background earthquakes. Because the same rule is applied to every event and all regions are analyzed using the same open USGS catalog, differences among the sequences reflect the properties of the faults themselves rather than differences in data collection.
One of the most reliable ways to evaluate an aftershock sequence is to count the number of earthquakes that occurred after the mainshock within a defined area and over the same period of time. For such a comparison to be valid, only events above the magnitude threshold at which the catalog is considered sufficiently complete should be counted. Since approximately the 1990s, the global catalog maintained by the U.S. Geological Survey (USGS) has generally recorded earthquakes of magnitude 4.5 and above reliably in regions with well-developed seismic networks. However, catalog completeness still depends on focal depth and tectonic setting [13]. Therefore, M 4.5 is used here as a conservative lower threshold, and the comparison is limited to events from the modern era, beginning around 2004. This places all sequences under comparable conditions. The analysis includes the largest megathrust earthquakes of this period: Sumatra–Andaman (2004, Mw 9.1) [14], Nias (2005, Mw 8.6), Bengkulu (2007, Mw 8.4), Chile–Maule (2010, Mw 8.8), Tohoku (2011, Mw 9.1) [15], and Kamchatka (2025, Mw 8.8) [3].
By this measure, Kamchatka 2025 does indeed stand out, although it does not set an absolute record (Fig. 2). During the first eleven months after the mainshock, approximately 1,568 events of magnitude 4.5 and above were recorded in the Kamchatka region, with about nine out of ten (89%) occurring within the first five months. This is considerably more than the 1,081 events recorded after the 2010 Chile–Maule earthquake, which was of similar magnitude. In terms of the number of aftershocks, Kamchatka nearly matches the 2004 Sumatra–Andaman event, which produced 1,673 aftershocks, even though the main Sumatra earthquake had a magnitude of Mw 9.1 and released approximately three times as much seismic energy. Only the 2011 Tohoku earthquake (Mw 9.1) ranks substantially higher in this dataset, with approximately 3,264 aftershocks, about twice as many as Kamchatka 2025.
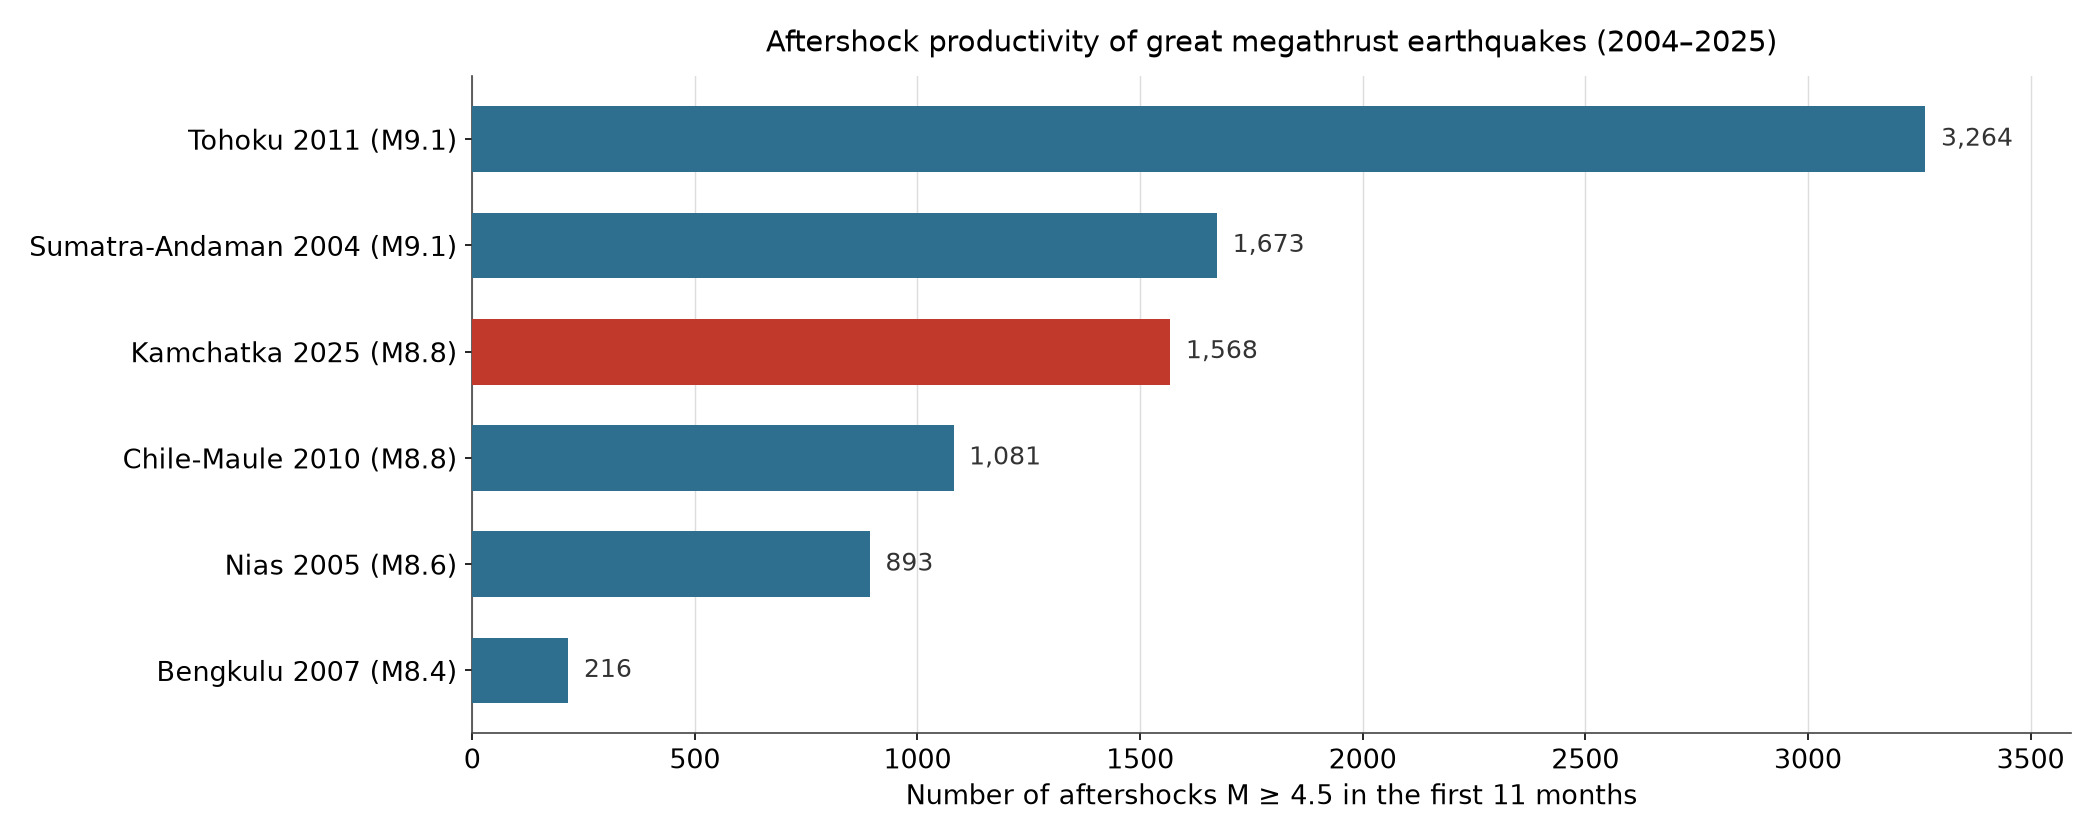
This comparison leads to an important conclusion: by the number of aftershocks above magnitude 4.5, Kamchatka 2025 ranks among the most active sequences of the modern era. Within the dataset examined, it is substantially surpassed only by Tohoku 2011 (Mw 9.1), while it is nearly on par with Sumatra–Andaman 2004 (Mw 9.1). The significance of this comparison becomes clear from the nature of the magnitude scale itself. Because the scale is logarithmic, the difference of only 0.3 magnitude units between 8.8 and 9.1 represents not a small increase, but an approximately threefold difference in energy released. In energy terms, one magnitude 9.1 event is roughly equivalent to three Kamchatka earthquakes. It is therefore particularly striking that Kamchatka nearly matched Sumatra (Mw 9.1) in the number of aftershocks despite releasing approximately three times less energy. For an event of its size, the 2025 Kamchatka sequence was extraordinarily rich in aftershocks.
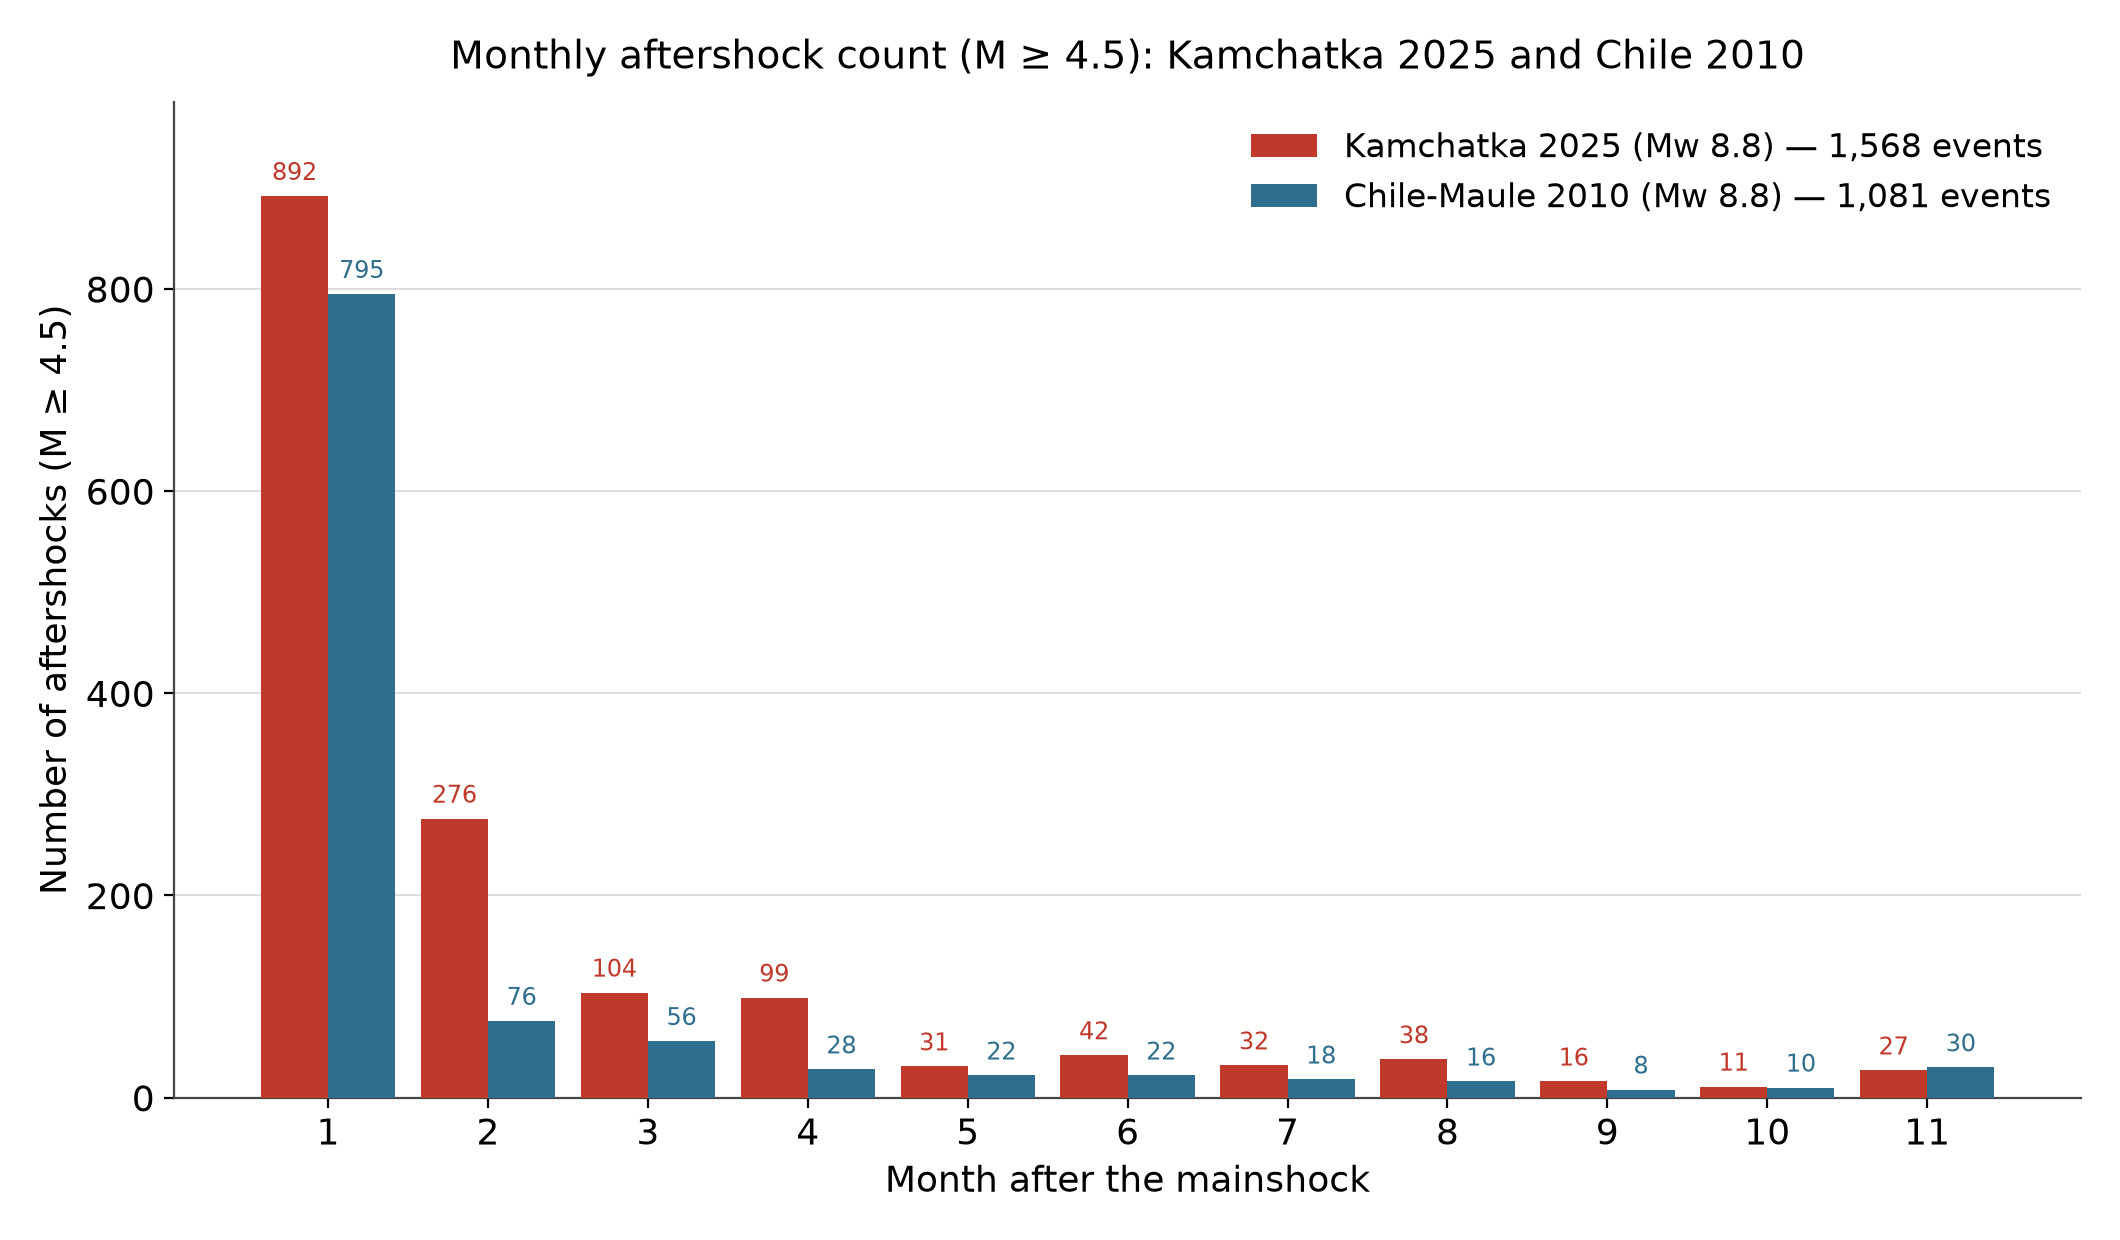
The 2010 Chile–Maule earthquake [16] occurred in a different region, but its key parameters make it the closest analog to Kamchatka 2025: the same moment magnitude of Mw 8.8, a similar focal depth of more than 30 kilometers [17], and the same type of tectonic setting, a megathrust. The clearest comparison can therefore be made by aligning both sequences with the day of their respective mainshocks and calculating, under the same criteria and using the same catalog, the monthly number of aftershocks of magnitude 4.5 and above (Fig. 3). In both cases, the first month was highly active, with 892 events in Kamchatka compared with 795 in Chile. Both sequences then began to decay, as typically occurs after major earthquakes. However, Kamchatka remained above Chile month after month, with the most pronounced difference occurring during the second through fourth months. By then, the Chilean sequence had already declined to several dozen events per month, while hundreds of aftershocks were still being recorded in Kamchatka. During the same first eleven months following each mainshock, 1,568 earthquakes of magnitude 4.5 and above occurred in the Kamchatka region, compared with 1,081 in Chile. In other words, under comparable conditions, Kamchatka produced approximately one and a half times as many aftershocks. This is one of the principal observations concerning the 2025 sequence: what was unusual was not any single earthquake, but the overall duration and intensity of fault activity.
Why does the number of aftershocks matter? The practical significance of this measure lies in how long a region remains at elevated risk. For coastal populations in regions such as Kamchatka, a more prolific aftershock sequence means a longer period of danger. Strong aftershocks can be destructive in their own right and hinder rescue and recovery operations. Continued fault displacement also indicates further stress redistribution, the progression of which is difficult to predict. Therefore, a sequence with approximately one and a half times as many earthquakes as its closest analog is not merely a statistical distinction, but an important indicator of the duration of seismic hazard.
What makes the Kamchatka sequence particularly unusual is not only the total number of aftershocks or their magnitudes, but above all their temporal distribution. This feature becomes especially clear when viewed in the context of Omori’s law, one of the classic empirical laws of seismology, according to which the frequency of aftershocks decreases approximately in inverse proportion to the time elapsed since the mainshock [18, 19]. In a typical aftershock sequence, this produces a rapid increase in the cumulative number of events during the first few days, followed by a gradual flattening of the cumulative curve. In the case of Kamchatka 2025, after the expected decline during the first few weeks, a pronounced secondary surge in activity emerged (Fig. 4). Approximately 46 and 51 days after the mainshock, two major aftershocks of magnitude 7.4 and 7.8 occurred, each accompanied by its own secondary sequence. As a result, the slope of the cumulative curve increased sharply again during the very interval when, under ordinary Omori decay, it should already have begun to flatten markedly.
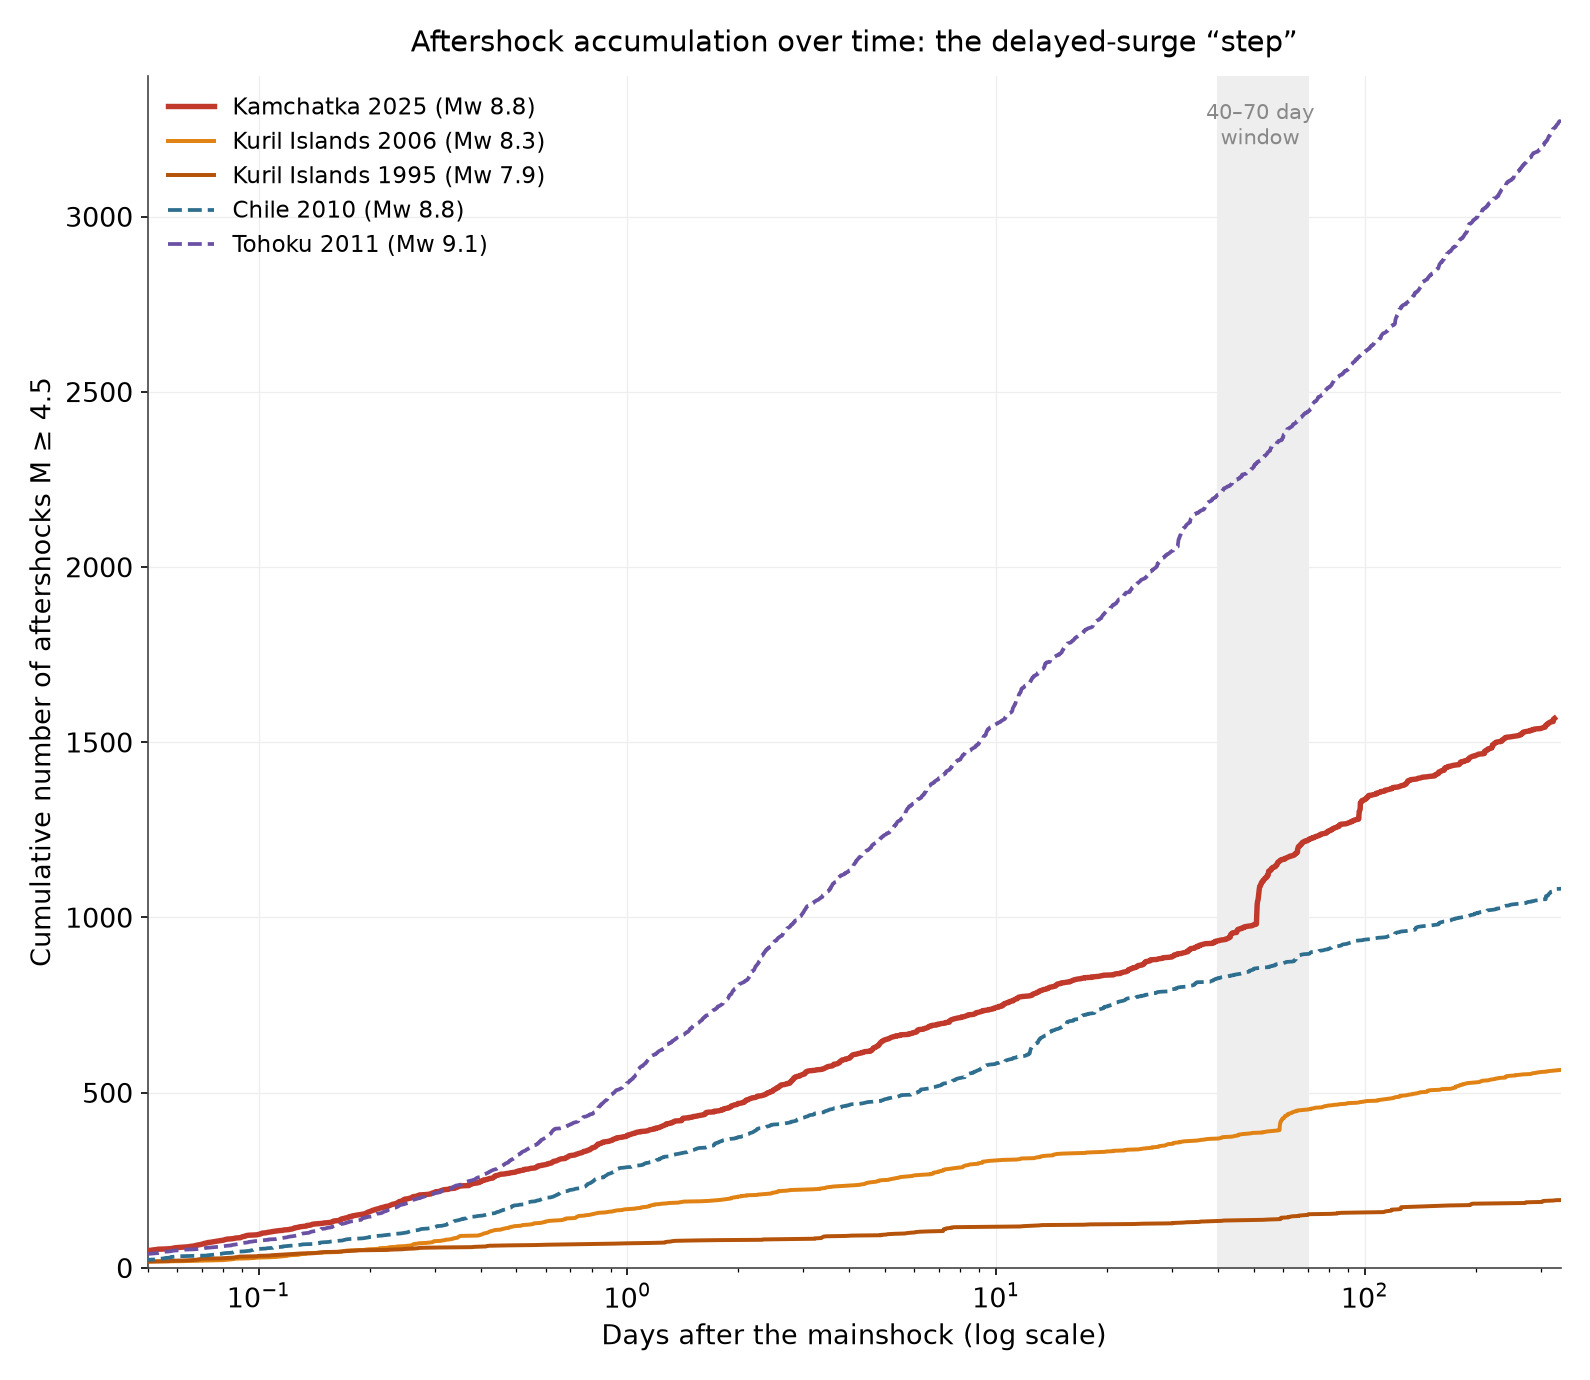
Importantly, such a delayed peak in aftershock activity is not unique to the 2025 Kamchatka sequence but is also observed in other modern events along the Kuril–Kamchatka Arc. Following the November 15, 2006, Simushir earthquake (Mw 8.3), the strongest aftershock, with a magnitude of 8.1, did not occur until day 59. In the 1995 Kuril earthquake sequence, the strongest aftershock occurred on day 66. Some of these delayed strong aftershocks are outer-rise events, which are sometimes regarded as independent earthquakes rather than aftershocks. However, this does not negate the systematic delay in the peak. By comparison, following the 2010 Chile earthquake and the 2011 Tohoku earthquake, the strongest aftershocks occurred within the first few hours after the mainshock, consistent with the general pattern observed for most major earthquakes worldwide. A comparison of mainshock magnitude and the time of the strongest aftershock in the global catalog shows that, in most sequences, the strongest aftershock occurs within the first few days, although the variation is wide and individual events deviate in both directions (Fig. 5). Against this background, modern events along the Kuril–Kamchatka Arc stand out because their strongest aftershocks occurred several weeks later: on day 51 for Kamchatka 2025, day 59 for the 2006 Kuril Islands event (the Simushir earthquake), and day 66 for the 1995 Kuril Islands event.
The distinction between a mainshock and an aftershock is not inherent in the nature of the event itself, but is determined by the declustering algorithm. It should therefore be noted that applying the Gardner–Knopoff windows preserves the delays for seven of the eight events. The exception is the 2006 event, for which the M 8.1 aftershock of January 2007 is classified as an independent earthquake under the stricter scheme, forming the 2006–2007 Simushir doublet. Formally, the magnitude 8.1 aftershock occurred 104 kilometers from the mainshock, while the window threshold is 102.5 kilometers, placing it approximately one and a half kilometers beyond the window boundary. Thus, the delayed timing observed for Kamchatka 2025 and the 1995 Kuril Islands event is robust across methods, whereas the result for the 2006 Kuril Islands event depends on how the 2007 earthquake is classified.
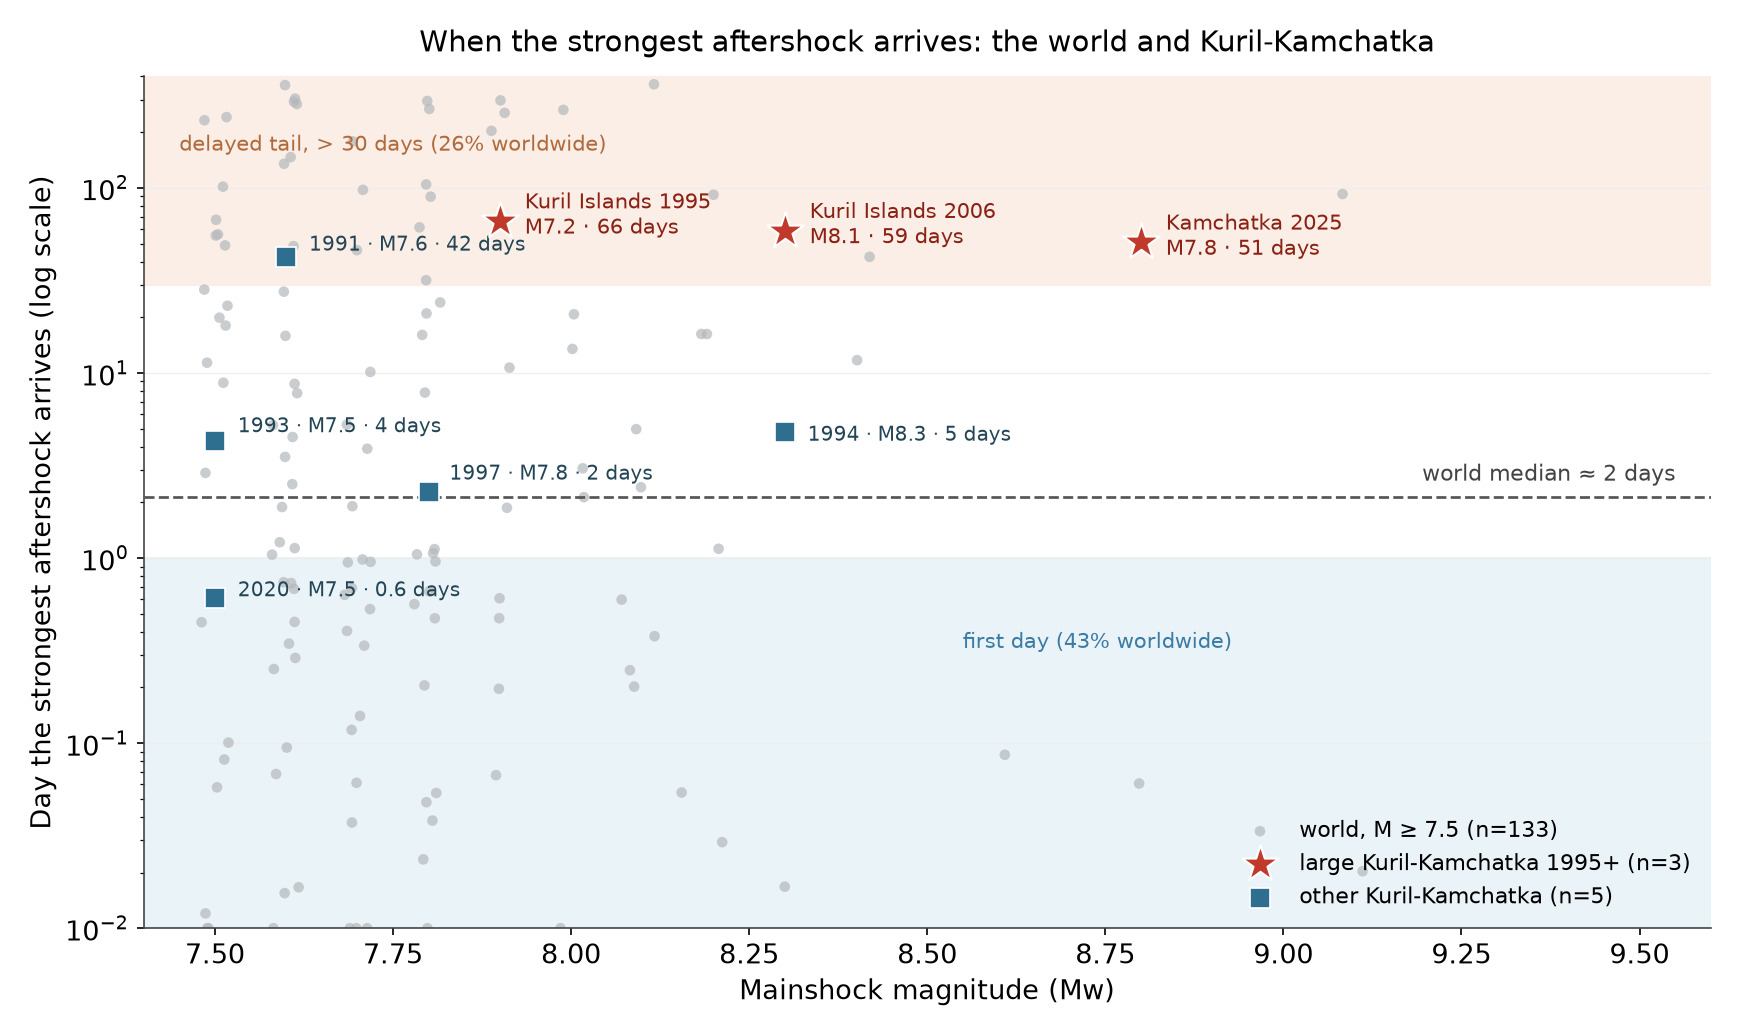
|
Year
|
Mainshock
|
Main Event Mw
|
Strongest Aftershock
|
Interval
|
|---|---|---|---|---|
|
1991
|
1991-12-22 08:43
|
7.6
|
1992-02-02 17:43 · M 5.8
|
42 days
|
|
1993
|
1993-06-08 13:03
|
7.5
|
1993-06-12 20:33 · M 6.3
|
4 days
|
|
1994 · Shikotan
|
1994-10-04 13:22
|
8.3
|
1994-10-09 07:55 · M 7.3
|
5 days
|
|
1995
|
1995-12-03 18:01
|
7.9
|
1996-02-07 21:36 · M 7.2
|
66 days
|
|
1997 · Kronotsky
|
1997-12-05 11:26
|
7.8
|
1997-12-07 17:56 · M 6.2
|
2 days
|
|
2006 · Simushir
|
2006-11-15 11:14
|
8.3
|
2007-01-13 04:23 · M 8.1
|
59 days
|
|
2020 · Paramushir
|
2020-03-25 02:49
|
7.5
|
2020-03-25 17:21 · M 5.1
|
0.6 days
|
|
2025
|
2025-07-29 23:24
|
8.8
|
2025-09-18 18:58 · M 7.8
|
51 days
|
What could account for such a delay in major aftershocks? Branching-process models, such as the Epidemic-Type Aftershock Sequence (ETAS) model, provide the most cautious framework for describing this phenomenon. In these models, each earthquake can generate its own subsequence [20]. Within this framework, a strongly cascading sequence can become self-exciting after a period of quiescence and produce a major delayed aftershock.
In addition to its productivity, the 2025 Kamchatka earthquake sequence exhibited two other features that should be noted specifically as observations. The first concerns timing. According to the available data, the strong seismic activity in 1952 was primarily associated with aftershocks following the main event. In 2025, strong earthquakes began before the main rupture. On July 20, a cluster of powerful foreshocks occurred, including a magnitude 7.4 event initially mistaken for the main rupture, as well as three more earthquakes, two of magnitude 6.6 and one of magnitude 6.5. The magnitude 8.8 earthquake itself occurred only nine days later, on July 29, 2025.
This cascade was preceded by a prolonged period of relative quiescence. Beginning around mid-2003, a persistent deficit of events of magnitude 5.0 and above was recorded within a 100-kilometer radius of the future hypocenter. This deficit lasted approximately twenty years and was abruptly replaced by renewed activity beginning with the magnitude 7.4 foreshock on July 20, 2025 [21]. Earlier still, in August 2024, a magnitude 7.0 earthquake occurred approximately fifty kilometers from the future hypocenter. The combination of a multiyear deficit in low-magnitude seismicity followed by abrupt activation is regarded as an indication that this segment of the plate boundary remained strongly locked until it ruptured.
However, strong foreshocks are not unprecedented among great megathrust earthquakes. The 2011 Tohoku earthquake was preceded by a magnitude 7.3 foreshock only two days before the mainshock. Kamchatka’s foreshock activity should therefore be regarded as striking, but not unique.
The second feature concerns the largest aftershocks. In September 2025, the Kamchatka fault produced two very strong aftershocks: Mw 7.4 on September 13 and Mw 7.8 on September 18. A well-known empirical relationship, Båth’s law, states that the largest aftershock is, on average, approximately 1.2 magnitude units smaller than the mainshock [22]. For a magnitude 8.8 event, this would yield an expected maximum of approximately 7.6. The magnitude 7.8 aftershock on September 18 exceeded this level. However, examining the entire dataset places this observation in context. The deficit of the largest aftershock based on its events ranges from approximately 1.0 to 1.7, close to the classical value of 1.2. Kamchatka, with a difference of 1.0, does lie on the large-aftershock side of the distribution but remains within the normal range of variation. By contrast, the 2004 Sumatra earthquake and its largest subsequent event, the 2005 Nias earthquake (Mw 8.6), yield a far more extreme difference of approximately 0.5, although Nias is often regarded as a separate great earthquake. In other words, Kamchatka’s large aftershock is notable, but not unique.
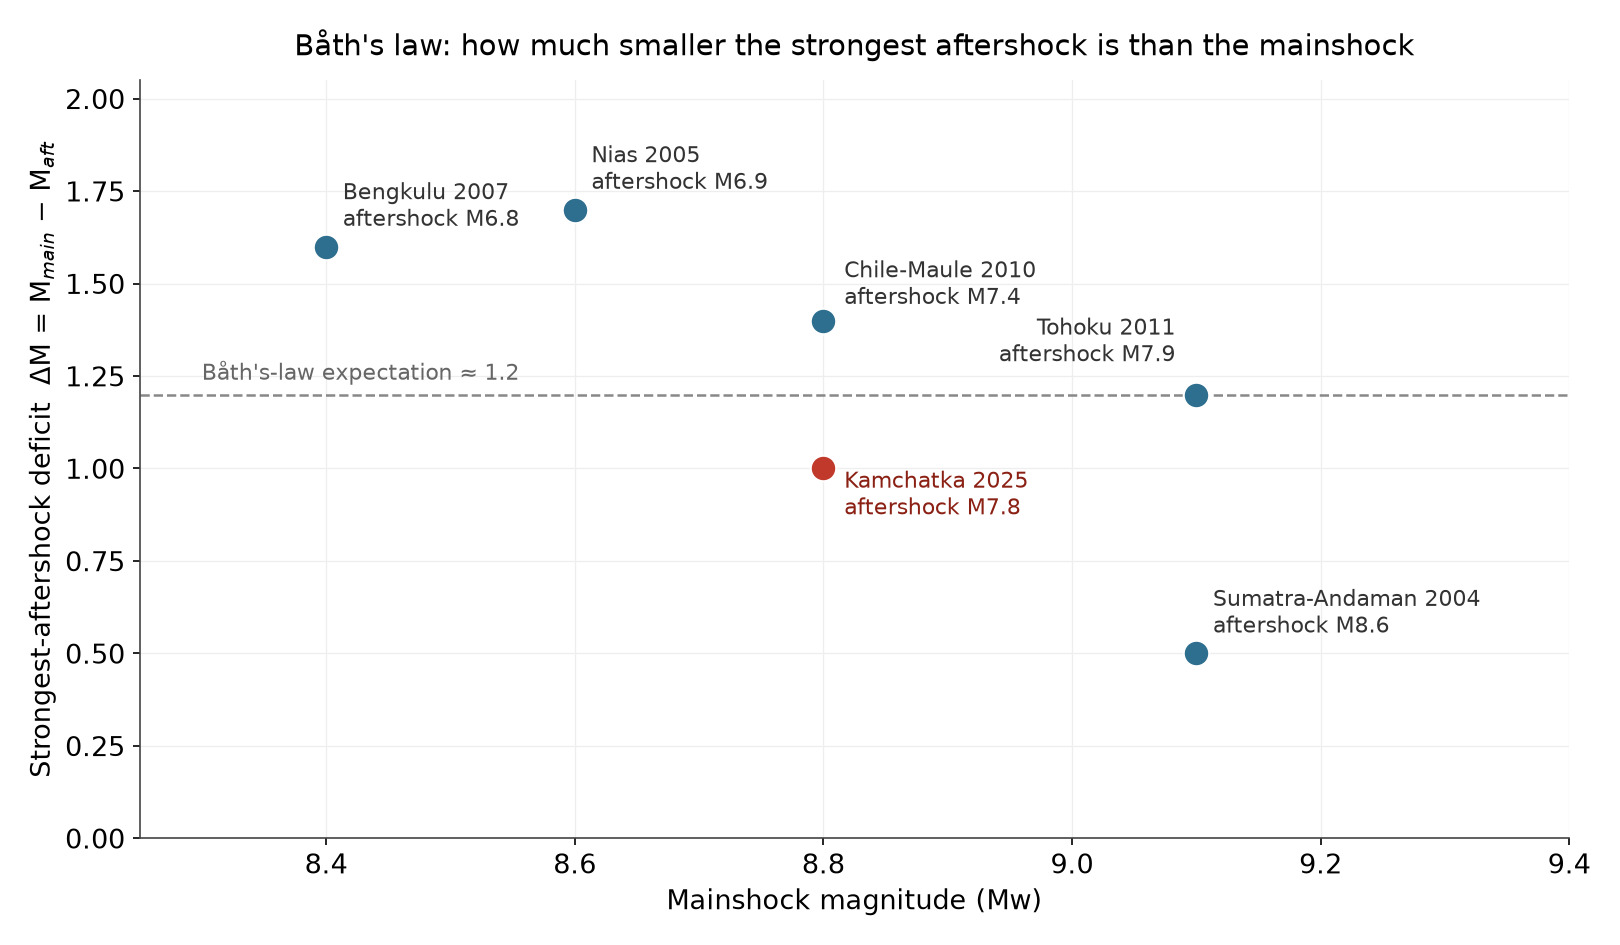
Taken together, the comparison based on the two empirical laws yields a fairly clear picture. According to Båth’s law, that is, in terms of the relative magnitude of the strongest aftershock, Kamchatka 2025 and other events in the Kuril–Kamchatka region generally do not differ from the global dataset. A different picture emerges when Omori’s law, which describes the temporal evolution of aftershock activity, is considered. In the modern era, the strongest aftershock in this region has tended to occur later, from several weeks to several months after the mainshock.
This conclusion resonates with another puzzle surrounding the event. The short interval of only seventy-three years between two mega-earthquake-class ruptures on the same segment is difficult to reconcile with the classical concept of the seismic cycle, according to which such enormous earthquakes release accumulated strain and recur only after centuries. Moreover, according to current models, the 2025 rupture displaced the fault by more than nine meters, with estimates ranging from eight to fourteen meters, whereas slow plate motion since 1952 could have restored only about six meters of elastic strain [3, 23]. The earthquake appears to have released more strain than had accumulated in the intervening period, a phenomenon known as “overshoot” [24]. Overshoot is also indicated by the nature of the aftershocks within the area of maximum slip. Normal-faulting earthquakes were recorded there, whereas thrust-faulting events would be expected under the prevailing compressional regime. This local reversal in the sign of shear stress indicates that the dynamic impulse of the rupture released the accumulated stress in excess [24].
One interpretation is that the 1952 earthquake was seismically “inefficient” and left a substantial portion of the stress unreleased. Another is that stress was redistributed from adjacent segments of the plate boundary. A third explanation allows for the possibility that the 1952 and 2025 earthquakes released strain in different depth ranges within the same megathrust segment. According to one reconstruction, the main slip in 1952 occurred at greater depths, approximately 30–60 kilometers, whereas in 2025 it was concentrated primarily at depths of about 15–30 kilometers. However, the rupture depth of the 1952 earthquake remains uncertain. Alternative models indicate substantial shallow slip and considerable overlap between the areas of large displacement in the two events (see references in [7]). Under the former interpretation, the 2025 event was not a repeat rupture of the same fault patch.
A fourth hypothesis concerns deeper processes, such as the influence of plume-like mantle structures on the Okhotsk Sea block. This should be regarded as a line of inquiry requiring separate investigation. It is supported by seismic tomography data showing extensive low-velocity mantle anomalies beneath Kamchatka and at its junction with the Aleutian Arc, as well as a tear in the Pacific Plate through which heated material rises toward the base of the mantle wedge [25, 26]. These thermal heterogeneities produce a patchwork distribution of locked areas along the plate boundary, and the boundaries of the largest ruptures often coincide with the edges of these areas.
Any of these possibilities introduces uncertainty into the simple linear models often used to estimate where and when great earthquakes recur, and none can be resolved through aftershock counts alone. However, the counts themselves provide a sufficiently robust observation on which to base further research. Using the same catalog, magnitude threshold, and mainshock-aligned time windows, the 2025 Kamchatka earthquake produced one of the most prolific aftershock sequences of the modern era, second only to Tohoku 2011, while also featuring an unusually strong foreshock and aftershock. This is a robust quantitative signal: one of the planet’s most hazardous fault systems is exhibiting behavior that can be described only partially by established benchmark cases. Further research should therefore focus on targeted modeling, new field and geodetic observations, and continued monitoring of coastlines where great earthquakes remain a recurring feature of tectonic reality.
About the authors

References
- U.S. Geological Survey. “M 8.8 — 2025 Kamchatka Peninsula, Russia Earthquake.” ANSS Comprehensive Earthquake Catalog, 2025. https://earthquake.usgs.gov/earthquakes/eventpage/us6000qw60/executive
- Eggert S., Walter T. R. “Volcanic Activity before and after Large Tectonic Earthquakes: Observations and Statistical Significance.” Tectonophysics 471 (2009): 14–26. https://doi.org/10.1016/j.tecto.2008.10.003
- Liu C., Bai Y., Lay T., et al. “Simple Unilateral Rupture of the Great Mw 8.8 2025 Kamchatka Earthquake.” Science 391 (2026): 812–817. https://doi.org/10.1126/science.aeb8232
- Scholz C. H. The Mechanics of Earthquakes and Faulting. 2nd ed. Cambridge University Press, 2002. https://doi.org/10.1017/CBO9780511818516
- U.S. Geological Survey. “M 9.0 — 89 km ESE of Petropavlovsk-Kamchatsky, Russia (1952).” ANSS Comprehensive Earthquake Catalog, 2016. https://earthquake.usgs.gov/earthquakes/eventpage/official19521104165830_30/executive
- MacInnes B. T., Weiss R., Bourgeois J., et al. “Slip Distribution of the 1952 Kamchatka Great Earthquake Based on Near-Field Tsunami Deposits and Historical Records.” Bulletin of the Seismological Society of America 100 (2010): 1695–1709. https://doi.org/10.1785/0120090376
- Sun G., Song P., Zhang G. “Curved Megathrust Geometry and Locking Heterogeneity Contributed to the Rupture of the 2025 Mw 8.8 Kamchatka Earthquake, as Inferred from Geodesy and Seismic Data.” Remote Sensing 18 (2026): 1803. https://doi.org/10.3390/rs18111803
- Pinegina T. K., Ozerov A. Y., Tsvetkov V. A., et al. “Tsunami from the Mw 8.8 Kamchatka Earthquake of 29 July 2025 on the East Coast of Kamchatka and the North Kuril Islands.” Pure and Applied Geophysics 183 (2026): 1–25. https://doi.org/10.1007/s00024-025-03873-1
- Fedotov S. A., Solomatin A. V. “Long-Term Earthquake Prediction (LTEP) for the Kuril–Kamchatka Island Arc, June 2019 to May 2024; Properties of Preceding Seismicity, January 2017 to May 2019.” Journal of Volcanology and Seismology 13 (2019): 349–362. https://doi.org/10.1134/S0742046319060022
- Amante C., Eakins B. W. ETOPO1 1 Arc-Minute Global Relief Model: Procedures, Data Sources and Analysis. NOAA Technical Memorandum NESDIS NGDC-24. NOAA, 2009. https://doi.org/10.7289/V5C8276M
- Bird P. “An Updated Digital Model of Plate Boundaries.” Geochemistry, Geophysics, Geosystems 4 (2003): 1027. https://doi.org/10.1029/2001GC000252
- Wells D. L., Coppersmith K. J. “New Empirical Relationships among Magnitude, Rupture Length, Rupture Width, Rupture Area, and Surface Displacement.” Bulletin of the Seismological Society of America 84 (1994): 974–1002. https://doi.org/10.1785/BSSA0840040974
- Kagan Y. Y. “Accuracy of Modern Global Earthquake Catalogs.” Physics of the Earth and Planetary Interiors 135 (2003): 173–209. https://doi.org/10.1016/S0031-9201(02)00214-5
- Lay T., Kanamori H., Ammon C. J., et al. “The Great Sumatra–Andaman Earthquake of 26 December 2004.” Science 308 (2005): 1127–1133. https://doi.org/10.1126/science.1112250
- Ammon C. J., Lay T., Kanamori H., et al. “A Rupture Model of the 2011 off the Pacific Coast of Tohoku Earthquake.” Earth, Planets and Space 63 (2011): 693–696. https://doi.org/10.5047/eps.2011.05.015
- Vigny C., Socquet A., Peyrat S., et al. “The 2010 Mw 8.8 Maule Megathrust Earthquake of Central Chile, Monitored by GPS.” Science 332 (2011): 1417–1421. https://doi.org/10.1126/science.1204132
- Pirti A. “Investigation and Prediction of the 2010 Maule, Chile Earthquake by Using GNSS.” Journal of South American Earth Sciences 133 (2024): 104702. https://doi.org/10.1016/j.jsames.2023.104702
- Utsu T., Ogata Y., Matsu’ura R. S. “The Centenary of the Omori Formula for a Decay Law of Aftershock Activity.” Journal of Physics of the Earth 43 (1995): 1–33. https://doi.org/10.4294/jpe1952.43.1
- Ogata Y. “Estimation of the Parameters in the Modified Omori Formula for Aftershock Frequencies by the Maximum Likelihood Procedure.” Journal of Physics of the Earth 31 (1983): 115–124. https://doi.org/10.4294/jpe1952.31.115
- Ogata Y. “Statistical Models for Earthquake Occurrences and Residual Analysis for Point Processes.” Journal of the American Statistical Association 83 (1988): 9–27. https://doi.org/10.1080/01621459.1988.10478560
- Nanjo K. Z., Yazbeck J., Baughman I. T., et al. “Seismic Quiescence and Activation Prior to the 2025 M8.8 Kamchatka, Russia Earthquake.” arXiv, 2025. https://doi.org/10.48550/arXiv.2511.10750
- Helmstetter A., Sornette D. “Båth’s Law Derived from the Gutenberg–Richter Law and from Aftershock Properties.” Geophysical Research Letters 30 (2003): 2054. https://doi.org/10.1029/2003GL018186
- Xu D., Wang W., Ren Z. “Preliminary Slip Distribution of the July 29, 2025 Mw 8.8 Kamchatka Earthquake.” Earthquake Research Advances 6 (2026): 100427. https://doi.org/10.1016/j.eqrea.2025.100427
- Yagi Y., Fukahata Y., Okuwaki R., et al. “Breaking the Cycle: Short Recurrence and Overshoot of an M9-Class Kamchatka Earthquake.” Seismica 4 (2025). https://doi.org/10.26443/seismica.v4i2.2012
- Toyokuni G., Zhao D. “Deep Mantle Upwellings and Their Interactions with Subducting Slabs beneath the Kamchatka–Aleutian–Alaska Region.” Geophysical Journal International 246 (2026): ggag166. https://doi.org/10.1093/gji/ggag166
- Jiang G., Zhao D., Zhang G. “Seismic Tomography of the Pacific Slab Edge under Kamchatka.” Tectonophysics 465 (2009): 190–203. https://doi.org/10.1016/j.tecto.2008.11.019
© 2026 N. Albridge. This article is published under a Creative Commons Attribution 4.0 International licence (CC BY 4.0) unless a different licence is stated in the credit line of an individual item. The authors retain copyright; ALLATRA Natural Science Review holds the right of first publication. The Review charges no submission, publication, or article processing fees. © 2026 ALLATRA Inc.