

Seismicity in Summer 2026: Normal Patterns, Anomalies, and Open Questions
Abstract
Summer 2026 brought an unusually high number of reports of strong earthquakes. However, the number of independent earthquakes of magnitude 6 or greater remained close to the long-term average. By August 28, 73 independent earthquakes had been recorded, compared with an average of 71, while total seismic energy release remained near the median. June initially appeared unusually active, with 19 earthquakes of magnitude 6 or greater compared with the usual 11, but seven of the 19 were aftershocks, including four following the June 7 earthquake in the Philippines and three associated with large earthquakes from 2025.
For earthquakes of magnitude 7 or greater, however, a different pattern emerged. By August 28, 11 such earthquakes had occurred, compared with an average of 8.8 during 1995-2025, a period in which the rate was already elevated relative to earlier decades. Notably, the rate of magnitude 7 or greater earthquakes increased in the mid-1990s and has since remained about 30% higher than before that period. The increase remains statistically significant even after correcting for the search over all possible step-change years from 1985 to 2015, when the unusually active period from 2004 to 2011 is excluded, and when the analysis is repeated across three global earthquake catalogs. Moreover, the increase becomes more pronounced at higher magnitude thresholds, contrary to what would be expected if improvements in the observational network were responsible.
Several of the year’s largest earthquakes also had unusual characteristics. The two earthquakes in the Venezuelan doublet of June 24 occurred just 32 seconds apart, the shortest interval in the global catalog since 1970, and the sequence produced only one aftershock of magnitude 5 or greater, compared with a median of seven for earthquakes of similar magnitude and depth. The northern margin of South America also produced three independent earthquakes of magnitude 7 or greater in a single year, compared with a long-term average of approximately one every five years. Although the available geological evidence does not indicate a causal relationship among these events, their geographic concentration remains statistically significant after accounting for the multiple regions examined worldwide. These observations may reflect a shift in the regime of large-earthquake seismicity and should be examined alongside other indicators of Earth’s internal dynamics.
Article
Summer 2026 was marked by a succession of strong earthquakes that were widely reported in the news. A series of major earthquakes began in the Philippines on June 7, followed by the earthquake doublet in Venezuela on June 24 and earthquakes in Mexico on July 17, Japan on July 28, Colombia on August 10, and Indonesia on August 14 and 15. This article examines how unusual current global seismic activity is across different measures of seismicity. The analysis first considers the year through August 28 and then focuses on the summer months, when seismic activity was particularly high. It then examines the year’s largest earthquakes and their characteristics before placing the 2026 observations in the context of the long-term seismic record.
What the Number of Independent Earthquakes Shows
From January 1 through August 28, 73 independent earthquakes of magnitude 6 or greater occurred worldwide, compared with an average of 71 for the same period. By this measure, 2026 ranks 16th among 37 years of observations through the same calendar date. Total seismic moment release was 2.8 × 10²¹ N·m, compared with a median of 3.0 × 10²¹ N·m, placing 2026 near the middle of the historical range, at 20th out of 37 years through the same calendar date. No great earthquake (magnitude 8 or greater) has occurred so far; such events usually dominate the annual seismic energy total. The largest event was the magnitude 7.8 earthquake in the Philippines on June 7, followed by the magnitude 7.5 and 7.2 earthquakes in Venezuela on June 24.
What is an “independent” earthquake? Every strong earthquake changes the stress state of the surrounding rock and can trigger a series of weaker earthquakes, called aftershocks, over the following days, weeks, and sometimes months. Because aftershocks are part of the same earthquake sequence, they are not counted as separate independent events. For example, an earthquake that produces 20 aftershocks does not represent 21 independent earthquakes. An earthquake that is not part of such a sequence is treated as an independent event, or mainshock. In this analysis, independent earthquakes are identified using the classic Gardner-Knopoff procedure [1]. The procedure defines a space-time window around each earthquake that increases in size and duration with magnitude; events that fall within the window of a stronger earthquake are classified as part of the same sequence.
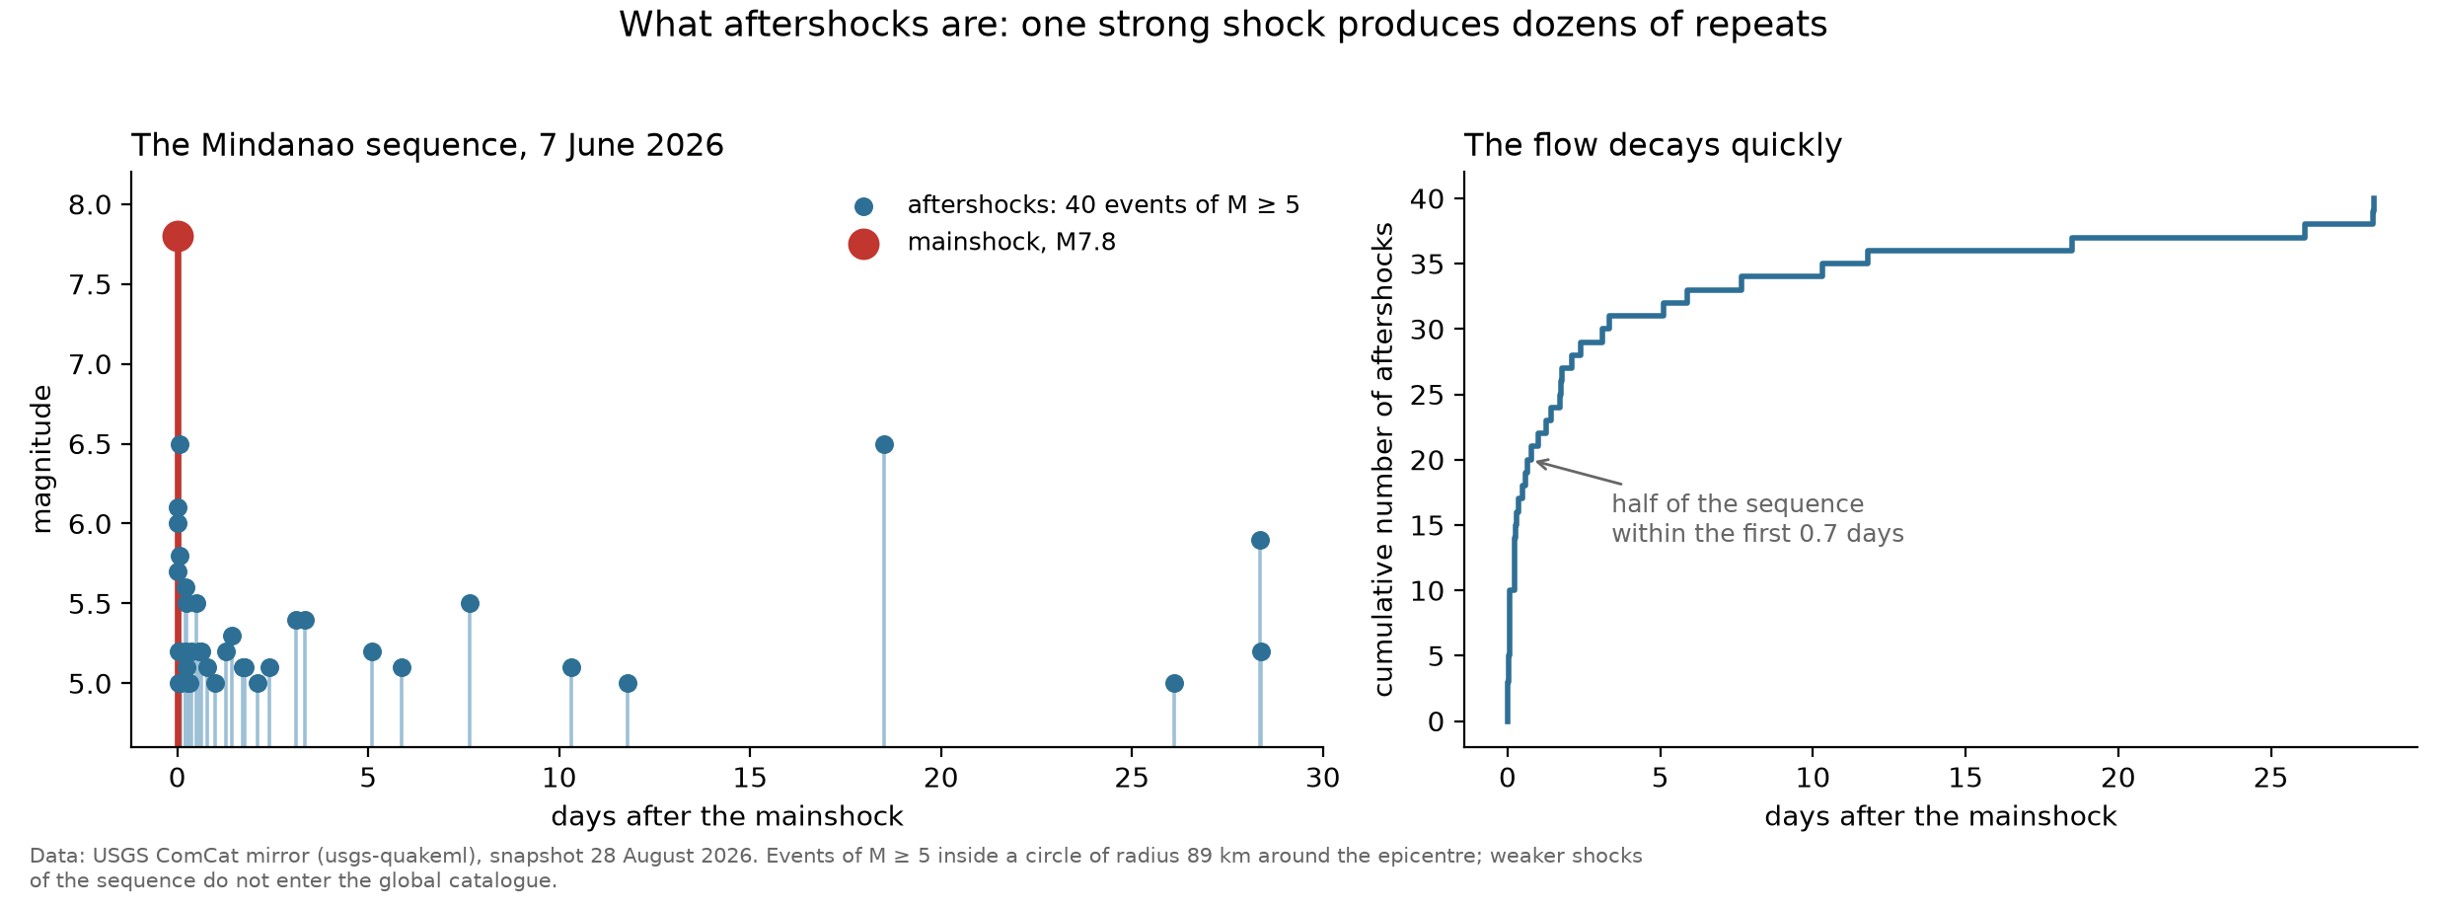
The magnitude 7.8 earthquake in the Philippines on June 7 initiated such a sequence, with 40 aftershocks of magnitude 5 or greater recorded within 89 kilometers over the next month; half occurred within the first day (Figure 1). The mainshock and its aftershocks are therefore treated as a single independent event in the analysis.
The following table lists all earthquakes of magnitude 6.5 or greater from June 1 through August 28, 2026, identifying each as either independent or part of another earthquake’s sequence.
|
Date and time (UTC)
|
Magnitude
|
Depth (km)
|
Region
|
Event type
|
|---|---|---|---|---|
|
2026-06-07 23:37
|
7.8
|
57
|
Mindanao, Philippines
|
Independent
|
|
2026-06-08 00:55
|
6.5
|
75
|
Mindanao, Philippines
|
Aftershock
|
|
2026-06-16 03:27
|
6.7
|
11
|
Sulawesi, Indonesia
|
Independent
|
|
2026-06-17 18:56
|
6.6
|
10
|
Mid-Atlantic Ridge
|
Independent
|
|
2026-06-19 06:52
|
6.6
|
14
|
Off the east coast of Kamchatka
|
Aftershock
|
|
2026-06-24 22:04
|
7.2
|
10
|
Coast of Venezuela
|
Independent
|
|
2026-06-24 22:05
|
7.5
|
10
|
Coast of Venezuela
|
Independent
|
|
2026-06-24 22:30
|
6.9
|
34
|
East coast of Honshu, Japan
|
Aftershock
|
|
2026-06-26 11:34
|
6.5
|
42
|
Mindanao, Philippines
|
Aftershock
|
|
2026-07-17 14:48
|
7.3
|
22
|
Coast of Chiapas, Mexico
|
Independent
|
|
2026-07-28 07:27
|
6.8
|
10
|
Kyushu, Japan
|
Independent
|
|
2026-08-10 12:34
|
7.4
|
110
|
Colombia
|
Independent
|
|
2026-08-14 21:58
|
7.7
|
10
|
Flores Sea, Indonesia
|
Independent
|
|
2026-08-15 10:54
|
6.9
|
173
|
Northern Sumatra, Indonesia
|
Independent
|
|
2026-08-20 18:00
|
6.7
|
99
|
Central Peru
|
Independent
|
The table lists 15 events, comprising 11 independent earthquakes and four aftershocks. Their geographic distribution is typical of global seismicity, with earthquakes occurring along the Pacific Ring of Fire, the Caribbean margin of South America, and the Mid-Atlantic Ridge.
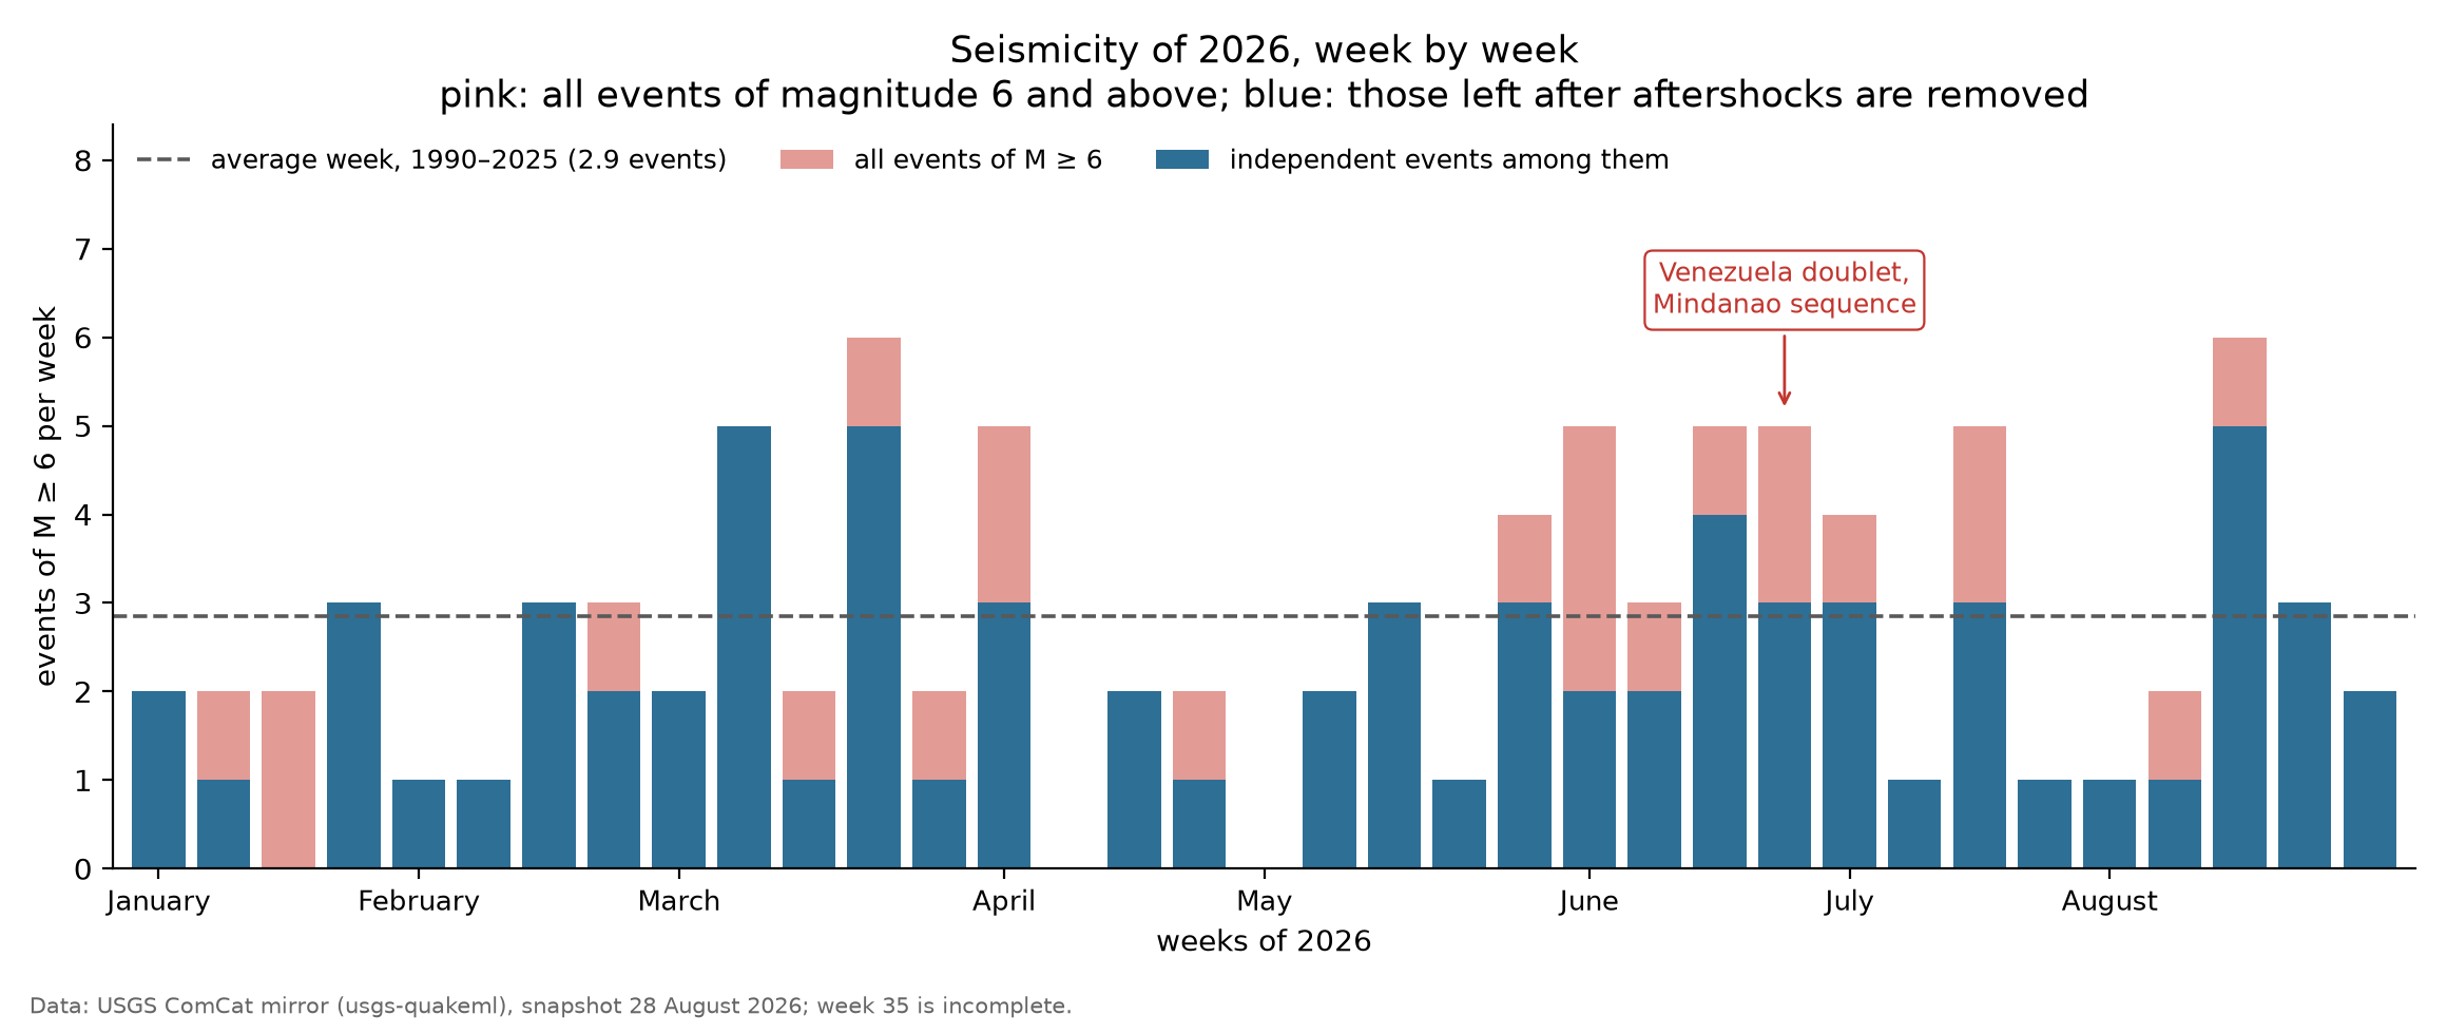
At weekly resolution, the pattern through August 28 is typical of global seismicity, with relatively quiet periods alternating with brief surges that often include aftershocks from one or two strong earthquakes (Figure 2).
Why Magnitude 6 or Greater Earthquakes Seemed So Frequent
In June, 19 earthquakes of magnitude 6 or greater occurred, compared with an average of 11. This exceeded the number recorded in 94% of all Junes since 1990, and the probability of observing 19 or more earthquakes based on the historical average is about 2%. In addition, from June 1 through August 28, 567 earthquakes of magnitude 5 or greater were recorded, compared with an average of 385. Only three summers in the 57-year record had higher totals, with 736 earthquakes in 2025, 609 in 2011, and 572 in 2021.
However, seven of the 19 June earthquakes were aftershocks. Four were associated with the magnitude 7.8 earthquake in the Philippines on June 7, 2026, while the other three were classified as part of sequences that began in 2025 under the Gardner–Knopoff procedure (its space-time windows can extend for months or years for large earthquakes). Specifically, the magnitude 6.0 earthquake in the Kuril Islands on June 7, 2026, was associated with the magnitude 6.0 earthquake of July 30, 2025; the magnitude 6.6 earthquake off the east coast of Kamchatka on June 19, 2026, with the magnitude 8.8 earthquake of July 29, 2025; and the magnitude 6.9 earthquake off the east coast of Honshu, Japan, on June 24, 2026, with the magnitude 7.6 earthquake of December 8, 2025. Removing these seven aftershocks leaves 12 independent earthquakes, compared with an average of 8.4 independent earthquakes in June during 1990-2025. Although above average, a count of 12 independent earthquakes is not unusual, as 12 or more were recorded in five Junes over the past 36 years.
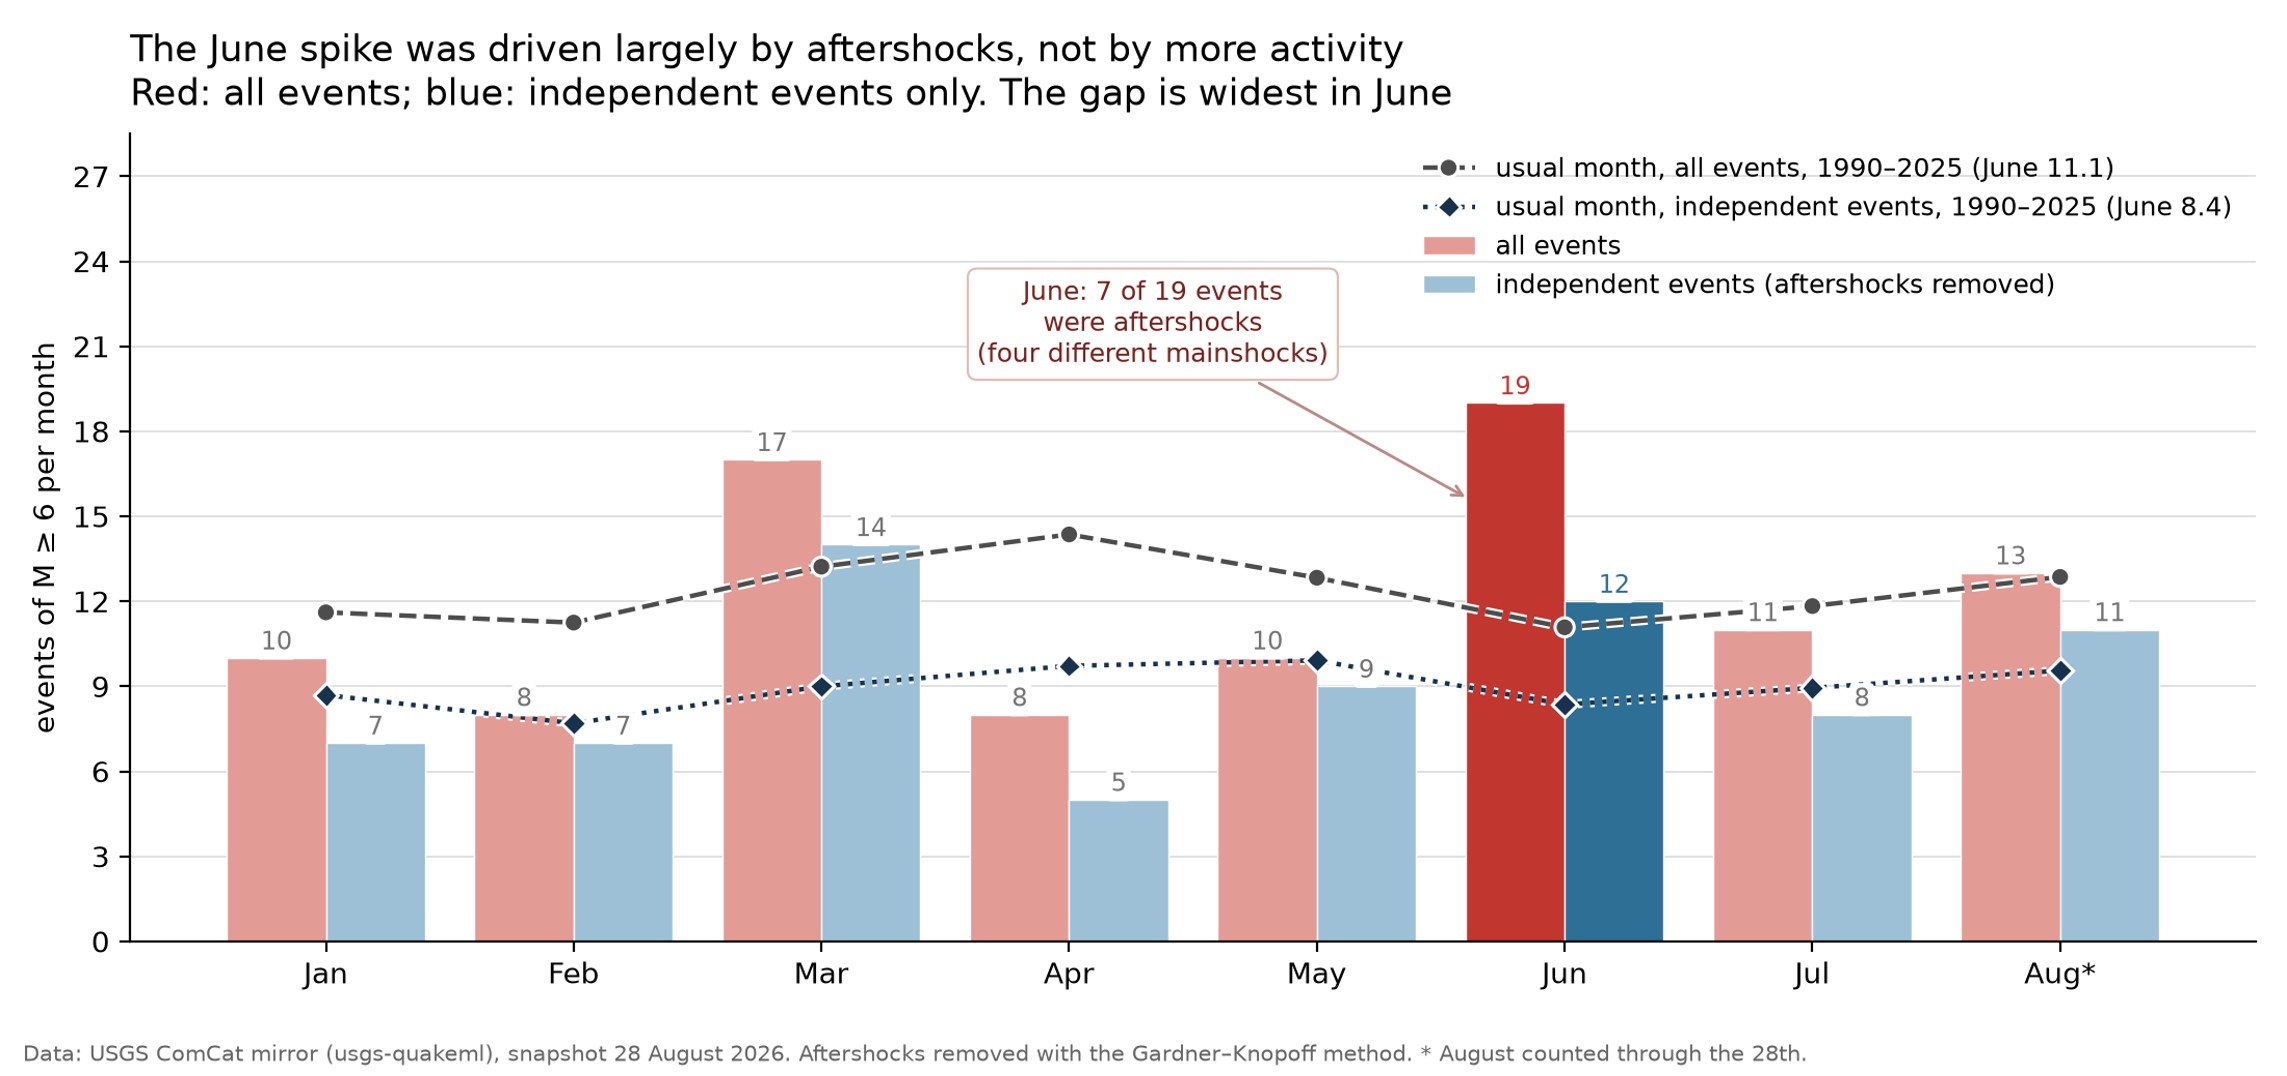
A comparison with March 2026 makes this effect especially clear. In March, 14 independent earthquakes of magnitude 6 or greater were recorded, more than the 12 recorded in June. Yet March made little impression on public perception because its earthquakes did not produce prolonged aftershock sequences and were distributed more evenly throughout the month. Perceptions of magnitude 6 or greater seismic activity this summer were therefore shaped not by the number of independent sources, but by how closely the earthquake reports were clustered in the news.
An Above-Average Number of Magnitude 7 or Greater Earthquakes
For larger earthquakes, however, a different pattern emerged. By August 28, 11 earthquakes of magnitude 7 or greater had occurred, compared with an average of 8.8 during 1995-2025, placing 2026 sixth highest out of 32 years and above 84% of the years examined. All 11 earthquakes were independent. The total was not a record: by the same date, 16 such earthquakes had occurred in 2010, 14 in 2021, and 13 in 2023. Years with this many large earthquakes were nevertheless uncommon. While the available data cannot show whether seismic activity will increase or decrease during the rest of the year, the elevated number of large earthquakes warrants attention because of their potential consequences for affected communities, including deaths, injuries, and the destruction of homes.


When interpreting these data, it is important to consider whether improvements in the observational network could account for the observed patterns. Earthquakes of magnitude 6 or greater, particularly those of magnitude 7 or greater, are readily detected by the global seismic network and are unlikely to be missed. In fact, the global catalog has been complete in this magnitude range since 1964, when the International Seismological Centre began operations and catalog completeness improved, with the magnitude threshold decreasing from 6.4 to 5.6 [2]. Earthquakes of about magnitude 7.5 or greater have been recorded since the beginning of the twentieth century.
Note that improvements in seismic monitoring have primarily increased the accuracy of magnitude estimates and the detection of smaller earthquakes rather than the detection of large earthquakes. Although magnitude estimates from the 1970s and today may not be directly equivalent, these differences do not materially affect counts of earthquakes of magnitude 6 or greater and are therefore unlikely to explain the elevated number of large earthquakes in 2026. Counts alone, however, do not capture the full pattern, as several of the largest earthquakes also exhibited unusual characteristics.
First Anomaly: The Venezuelan Earthquake Doublet
A detailed analysis of the Venezuelan doublet, including its tectonic setting, competing interpretations, and consequences, was published in the first issue of ALLATRA Natural Science Review [3]. This section focuses on the unusual features of the sequence and how they compare with thousands of other earthquake sequences in the global catalog.
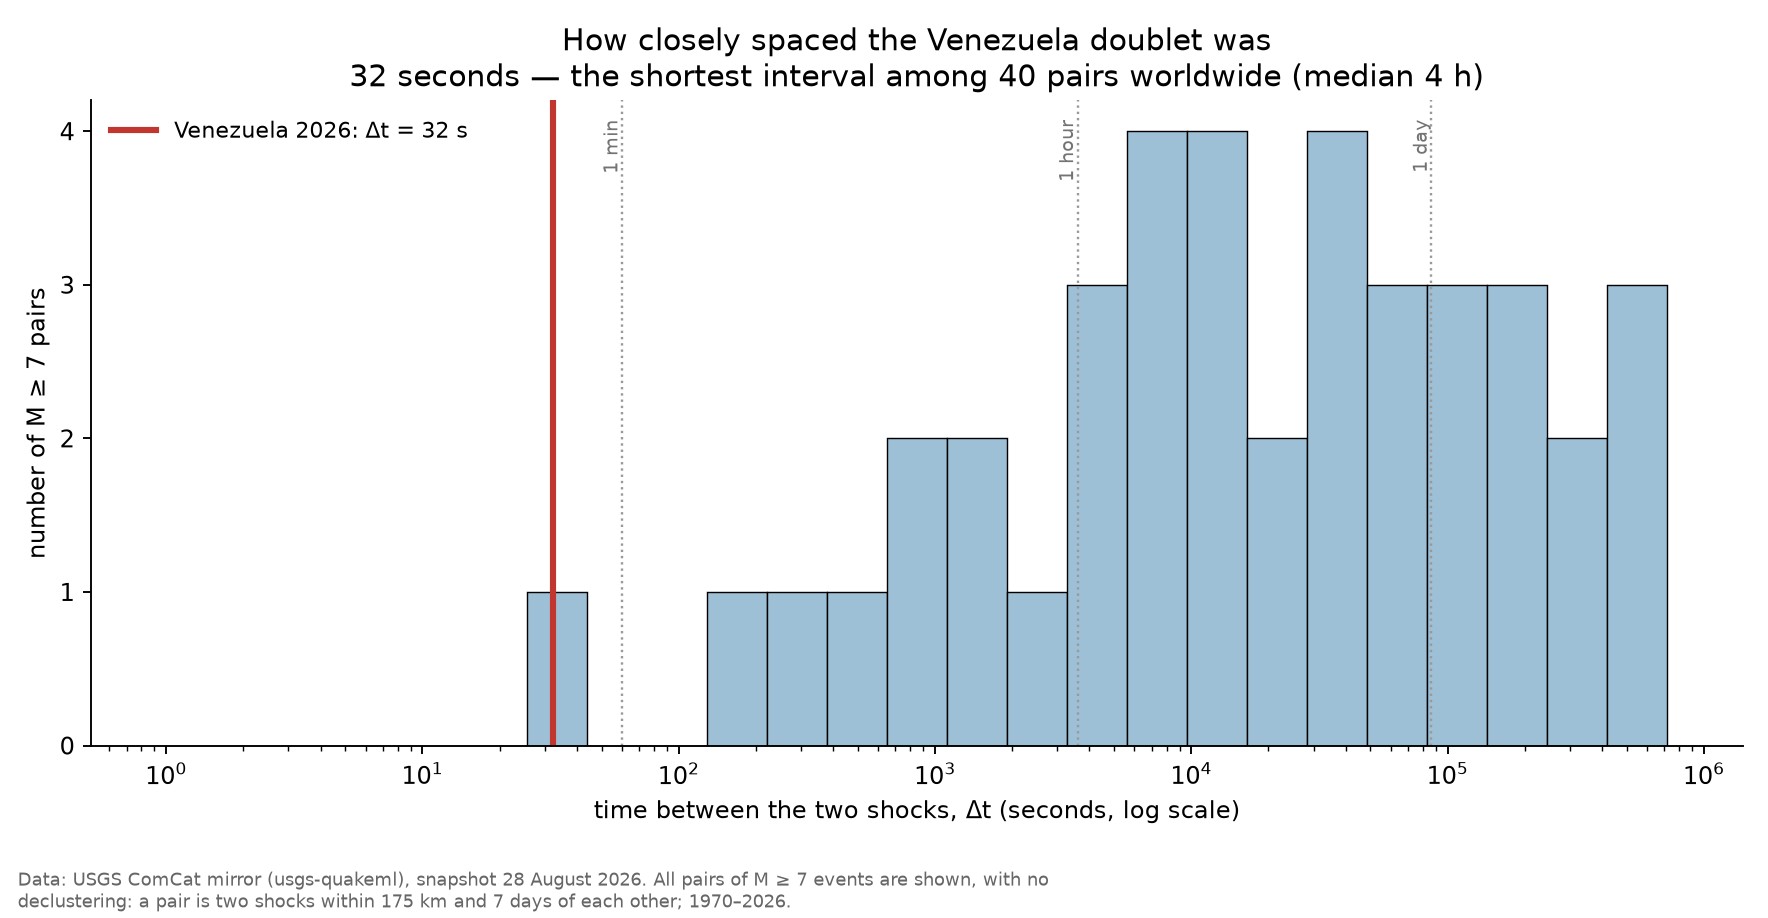
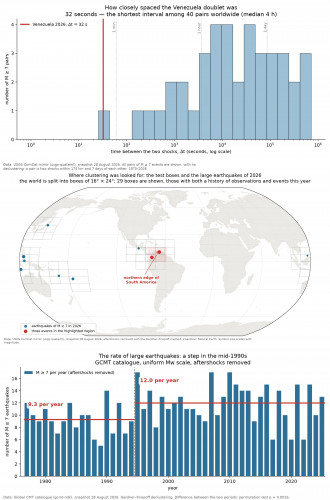
On June 24, two strong earthquakes of magnitude 7.2 and 7.5 struck off the coast of northern Venezuela. The earthquakes were initially estimated to be 39 seconds apart, but on August 2, the U.S. Geological Survey (USGS) revised the event parameters, changing the estimated interval to 32 seconds. The 32-second interval is the shortest between two earthquakes of magnitude 7 or greater in the global catalog since 1970, with the next-shortest interval being two and a half minutes (Figure 4).
The second distinctive feature of the sequence was the near-total absence of aftershocks, even though earthquakes of this magnitude typically generate several dozen during the first week. The global catalog, however, recorded only one aftershock of magnitude 5 or greater during the first week, compared with a median of seven for earthquakes of similar magnitude and depth, placing the sequence at approximately the 14th percentile of the global distribution of aftershock productivity (Figure 5). The magnitude difference between the mainshock and its largest aftershock was also unusually large, at 2.5 magnitude units compared with the typical value of about 1.2 described by Båth’s law [4], larger than that observed in 95% of the earthquake sequences analyzed. An earlier value of 3.0 reported in [3] was calculated before the USGS revision of August 2, 2026, which added a magnitude 5.0 aftershock to the sequence.
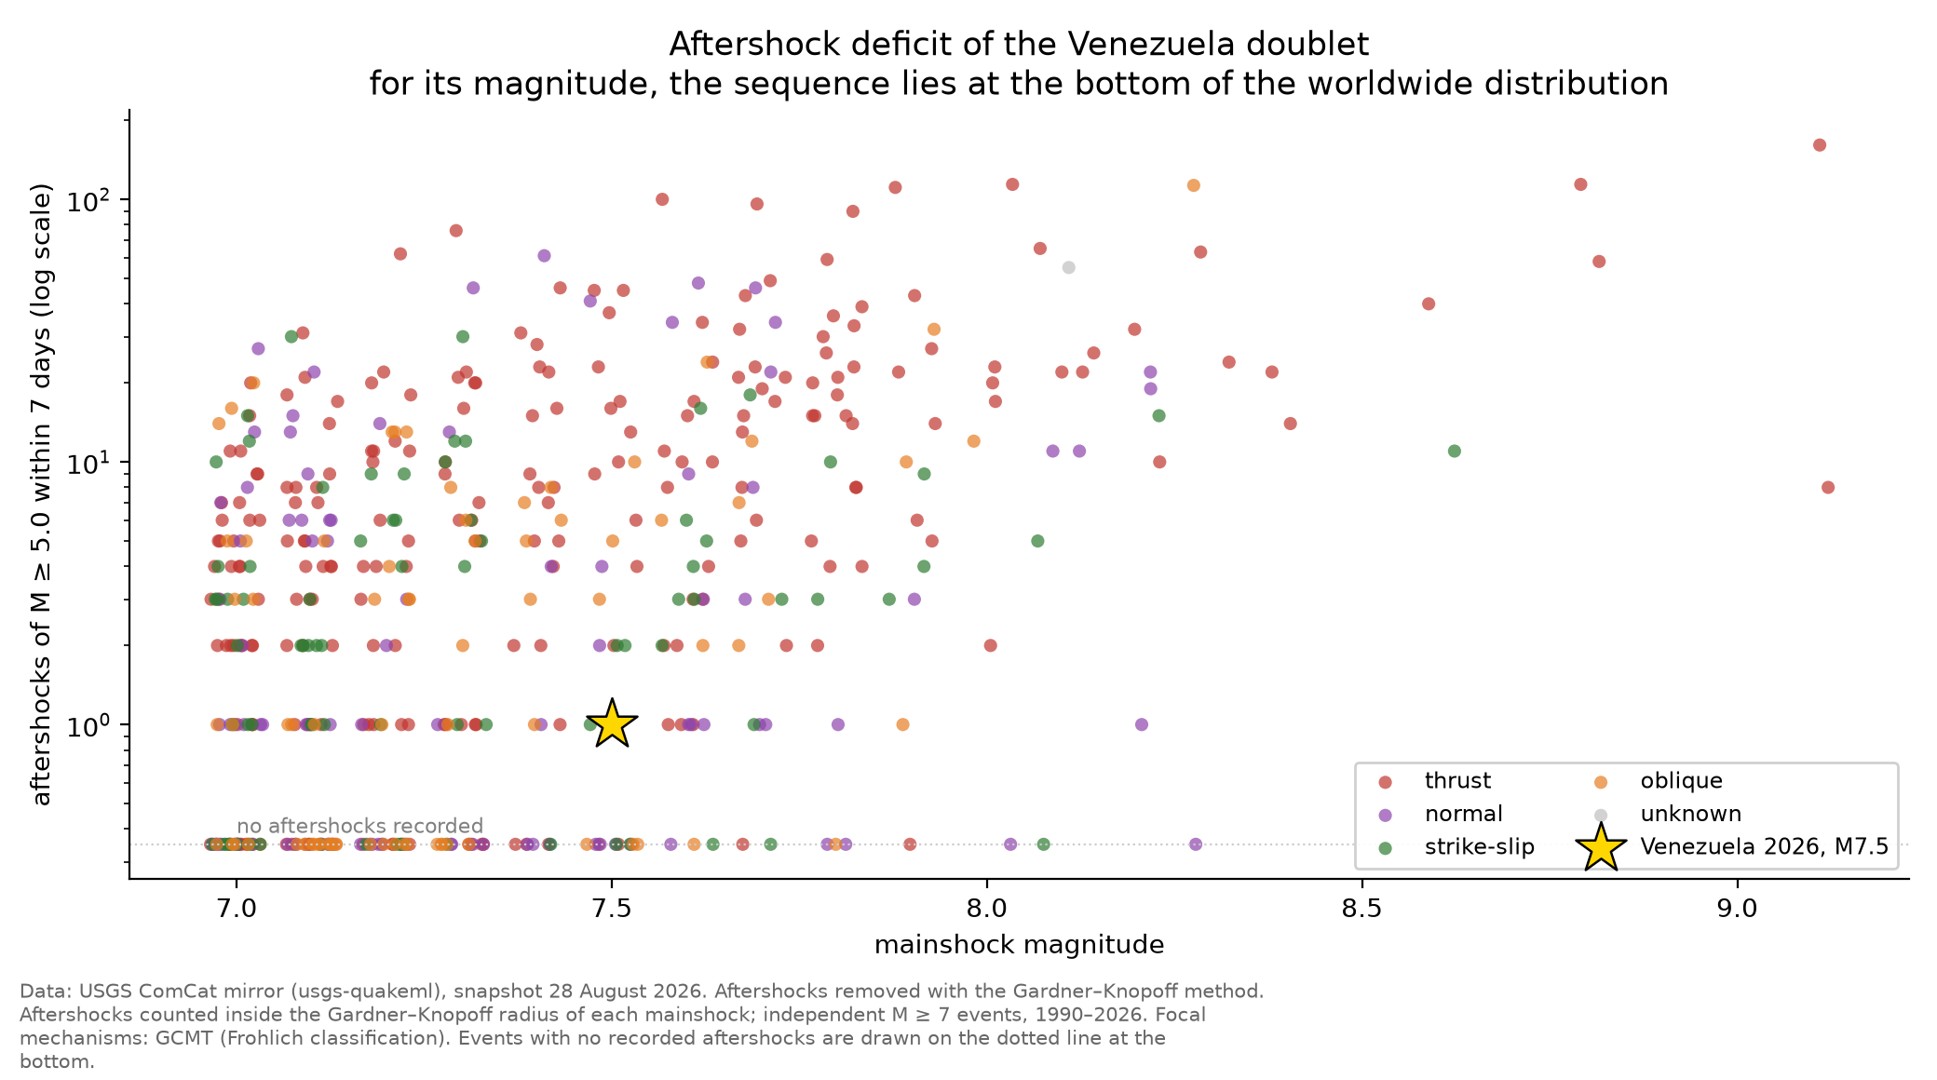
The low number of aftershocks in the global catalog does not mean that the sequence lacked smaller events. Venezuela’s national seismic network, FUNVISIS, detected more than 130 earthquakes ranging from approximately magnitude 2 to 3.6 that were not included in the global catalog. For earthquakes of magnitude 5 or greater, however, the global catalog is complete, so the comparison of aftershock counts remains reliable. At this magnitude threshold, the sequence therefore remains anomalously unproductive.
The interpretation of the doublet itself remains debated, however, with uncertainty over whether it represents two separate earthquakes or a single complex rupture. Typically, rupture during a magnitude 7.2 earthquake lasts about 30 seconds, so the first rupture may still have been in progress when the second began, making it difficult to determine which interpretation better describes the sequence. The USGS retains two separate events in its catalog, while GFZ in Germany, INGV in Italy, and GEOSCOPE in France, as well as the Global CMT catalog, report the sequence as a single event [3] (for consistency with the USGS catalog and the declustering method used here, the two events are treated separately in the earthquake counts). Following the August revision, the epicenters were estimated to be 152 kilometers apart, which over the 32-second interval corresponds to about 4.7 km/s. This apparent propagation speed is within the range associated with supershear rupture, in which rupture propagates faster than shear waves, and is substantially higher than the approximately 2.5-3 km/s typical of ordinary rupture propagation.
Such closely spaced large earthquakes can have serious implications. When two ruptures occur tens of seconds apart within the same fault system, their seismic waves can overlap at a given location. Even if the peak amplitude does not increase, structures may experience two episodes of strong shaking in rapid succession, with the second affecting buildings already damaged and soils weakened by the first. This can increase the total duration of strong shaking, which is itself an important factor in structural damage. In Venezuela, eastward rupture directivity concentrated seismic energy toward Caracas, where soft sediments beneath the city further amplified the resulting ground motion [3]. If the apparent propagation speed reflects supershear rupture, the shaking may also have been focused within a narrower, more intense band along the direction of rupture propagation. Such closely spaced ruptures may therefore present challenges for seismic hazard assessments based on individual rupture scenarios, as a doublet could produce more severe effects than either earthquake considered separately would suggest.
Second Anomaly: Three Large Earthquakes in One Region
In 2026, large earthquakes were unusually concentrated in one region. The northern margin of South America (the area from 0 to 16° N and from 82 to 58° W), including Colombia, Venezuela, and the Caribbean plate boundary, produced three independent earthquakes of magnitude 7 or greater — the two shocks on June 24 and the magnitude 7.4 earthquake in Colombia on August 10. Historically, this region has experienced approximately one such earthquake every five years. Over 56 years of observations, however, more than one had never occurred in a single year; based on the long-term average, the probability of three or more occurring within one year is approximately 1 in 1,000.
Findings of this kind require rigorous analysis because defining a region after the events have occurred can make a concentration appear more unusual than it would if the region had been specified in advance, a statistical problem known as multiple comparisons. To account for this effect, Earth’s surface was divided into overlapping areas measuring 16 degrees of latitude by 24 degrees of longitude, with adjacent areas overlapping by half their dimensions. The observed number of earthquakes was then compared with the historical rate for each area to determine how unusual the 2026 count was [3]. In total, 29 areas had sufficient historical data and at least one event in 2026 to be included in the analysis (Figure 6).
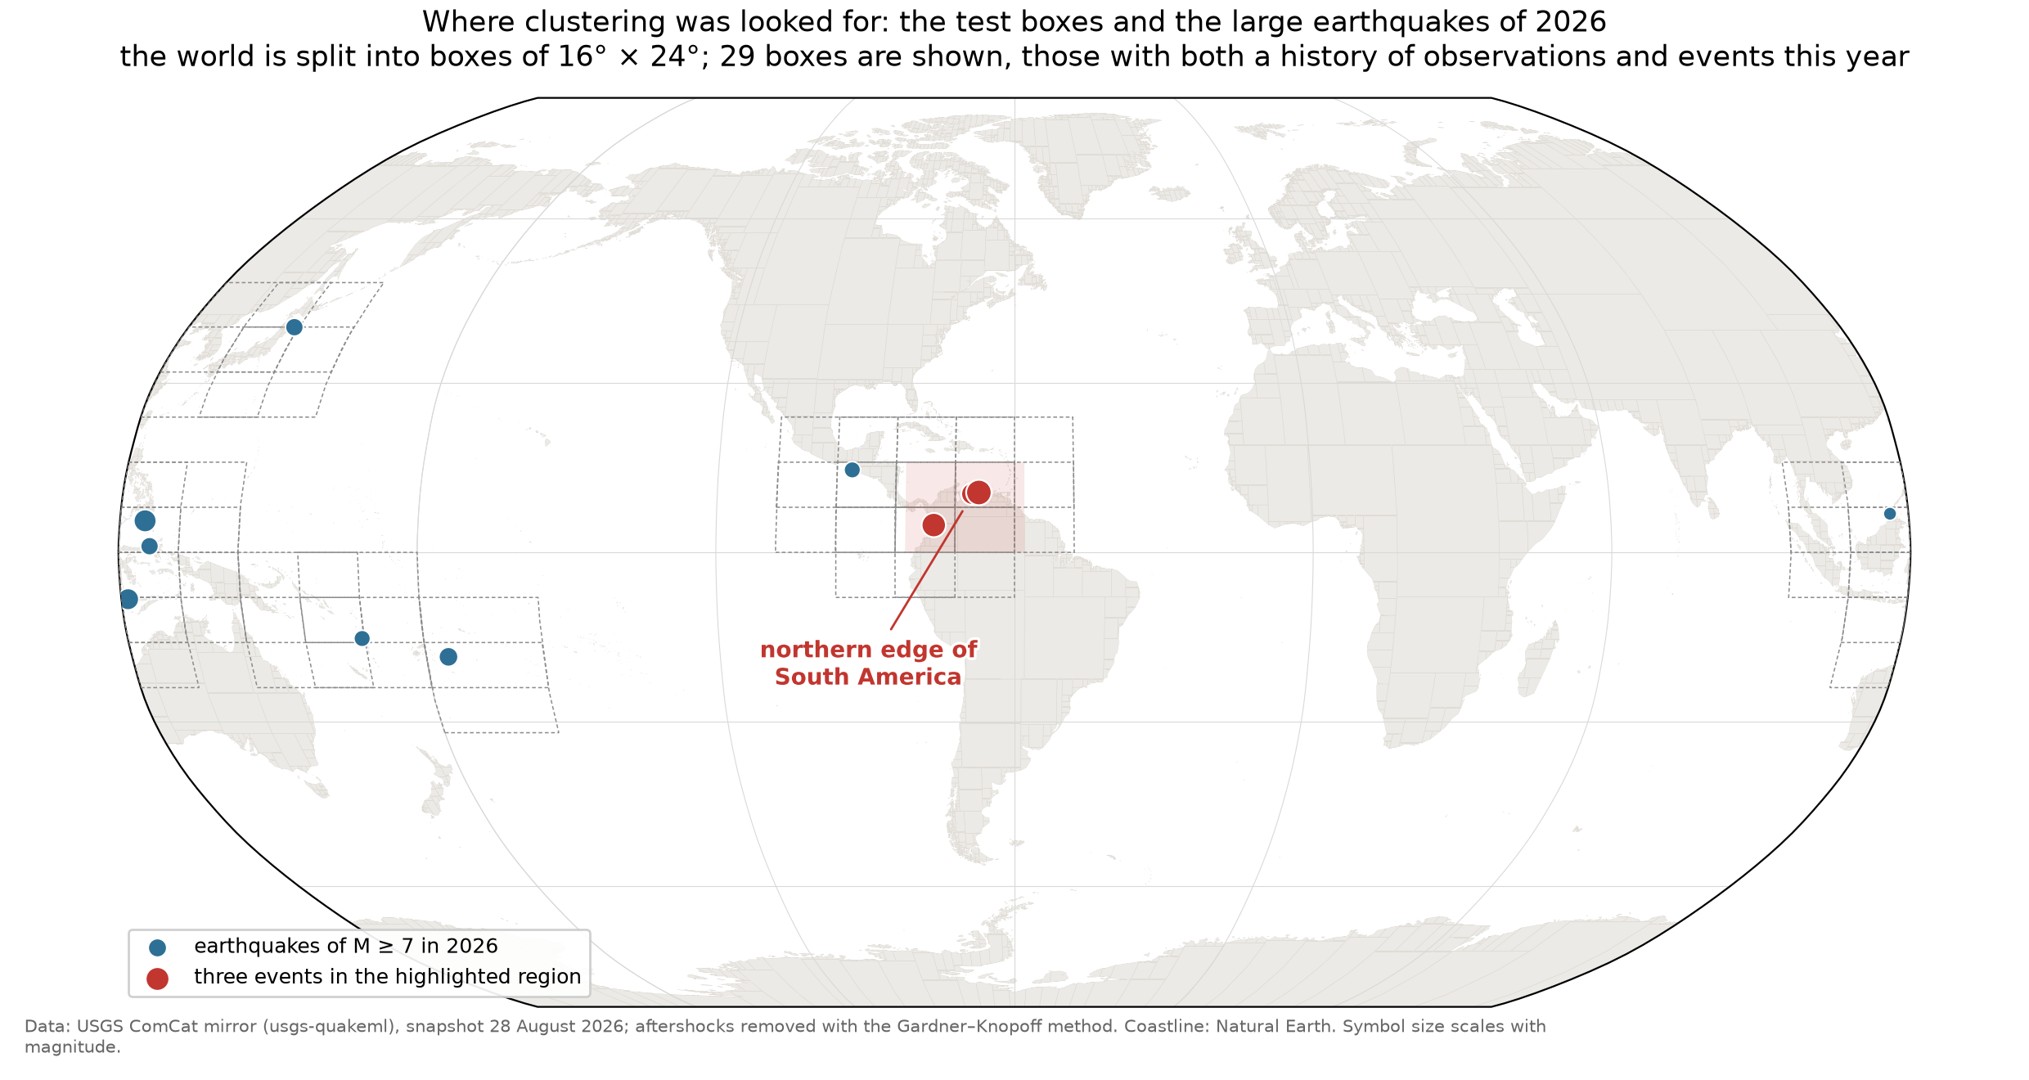
Across all areas examined, the expected number of false positives was only 0.03, and no area other than the northern margin of South America showed a comparable concentration of large earthquakes. The result therefore remains statistically significant after correction for multiple comparisons.
The observed concentration is a statistical association and does not by itself establish a causal relationship among the events. The Venezuelan earthquakes occurred in the upper crust at depths of less than 20 kilometers and resulted from right-lateral strike-slip motion along the boundary between the Caribbean and South American plates, whereas the Colombian earthquake occurred at a depth of more than 100 kilometers and was associated with movement of the Nazca Plate. The events involved different fault systems and rupture mechanisms, as noted by the Colombian Geological Service in an official statement [5]. This geographic concentration therefore remains statistically exceptional, with no known physical mechanism linking the events, and it warrants further study of the region.
Increase in Large Earthquake Frequency Since 1995
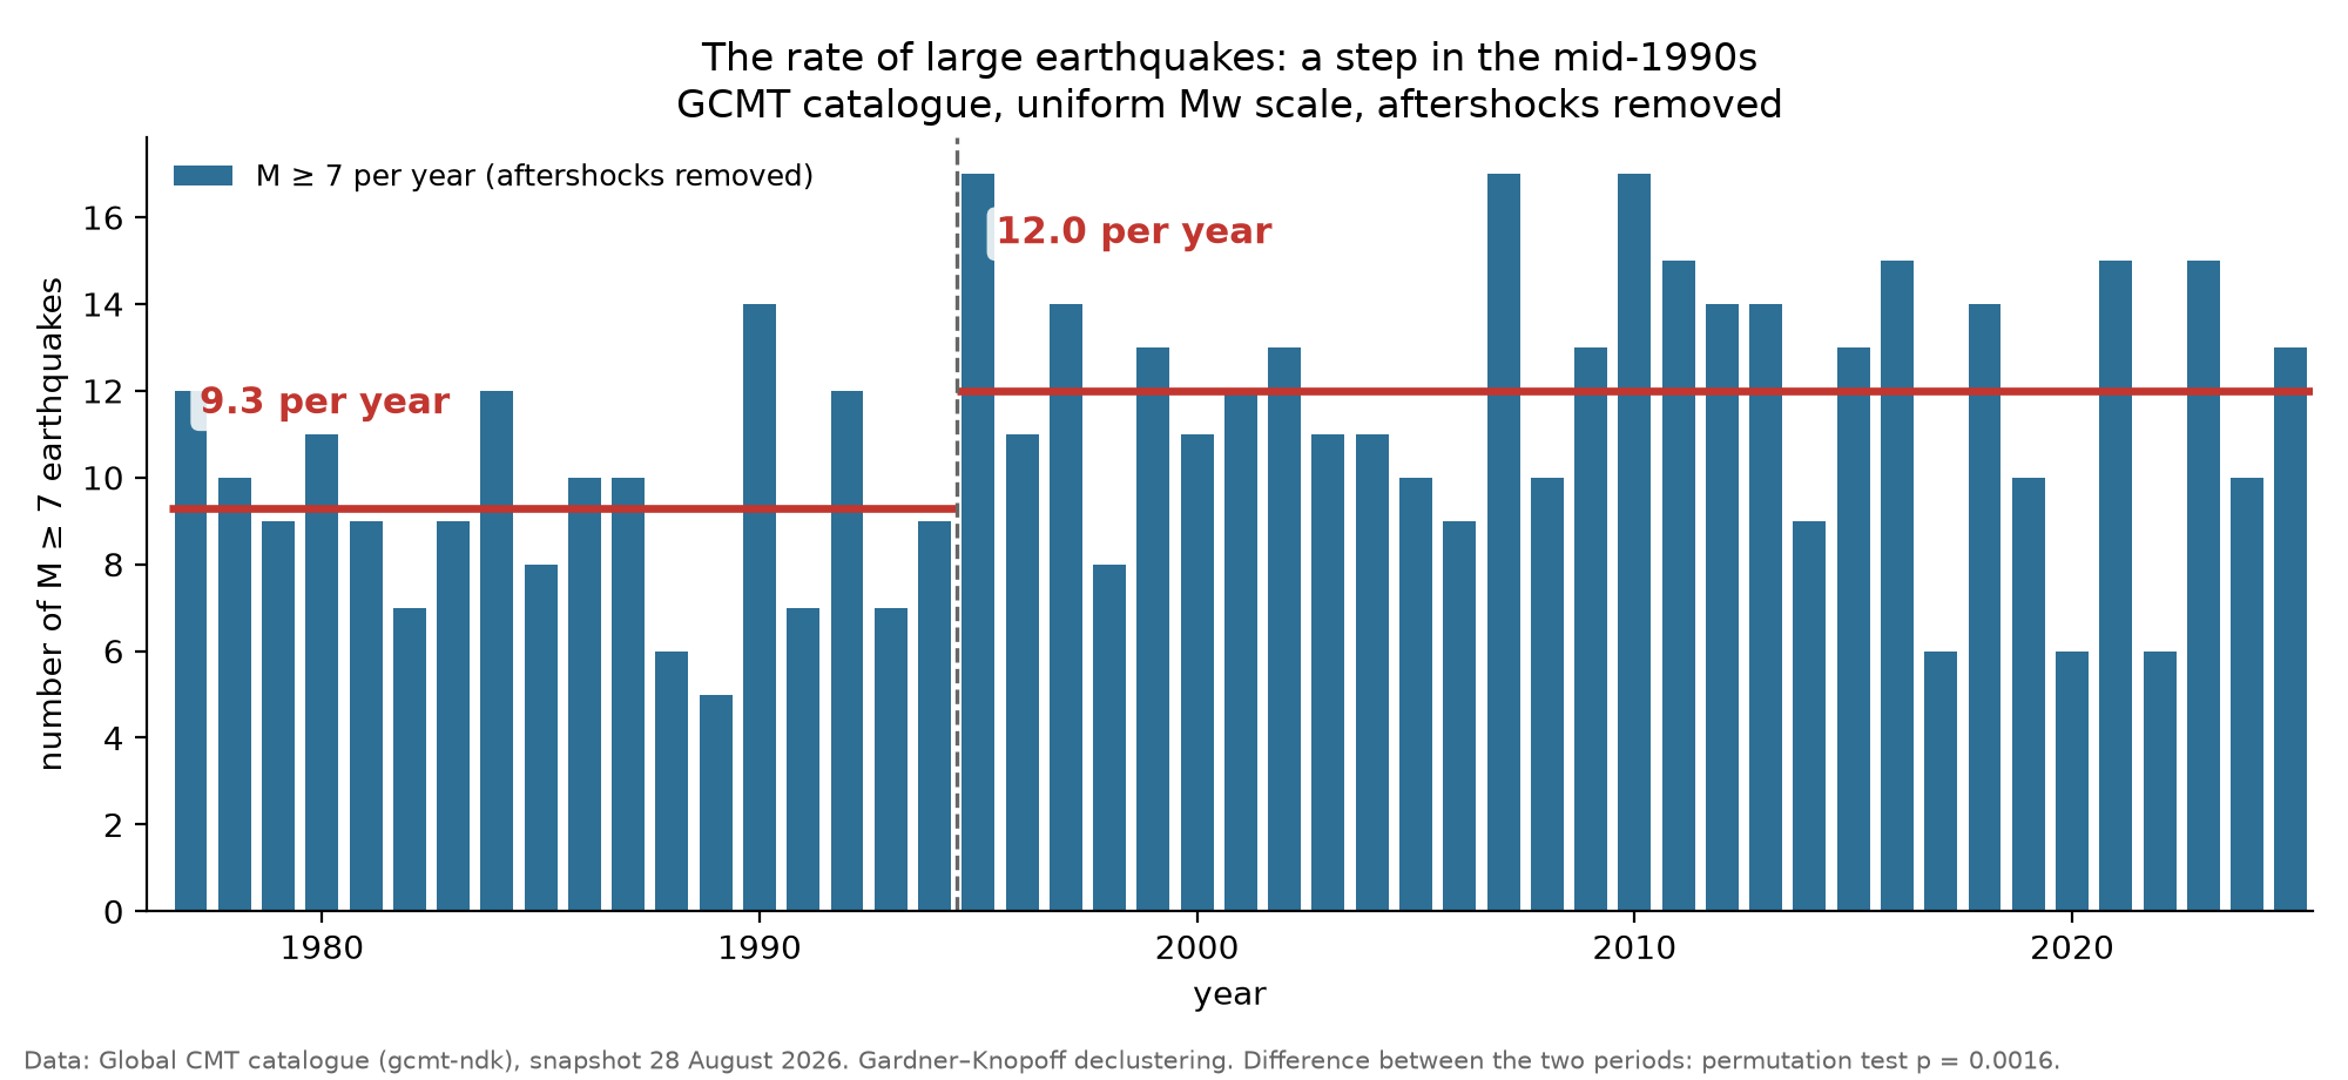
A different pattern emerges from the long-term record. When the analysis considers only earthquakes of magnitude 7 or greater in the Global CMT catalog and aftershocks are removed, the average annual number of events was 9.3 before 1995 and 12.0 from 1995 onward. The transition occurred as a step change rather than a gradual increase, with the annual rate rising by approximately 30% and remaining at the higher level for the next 30 years (Figure 7).
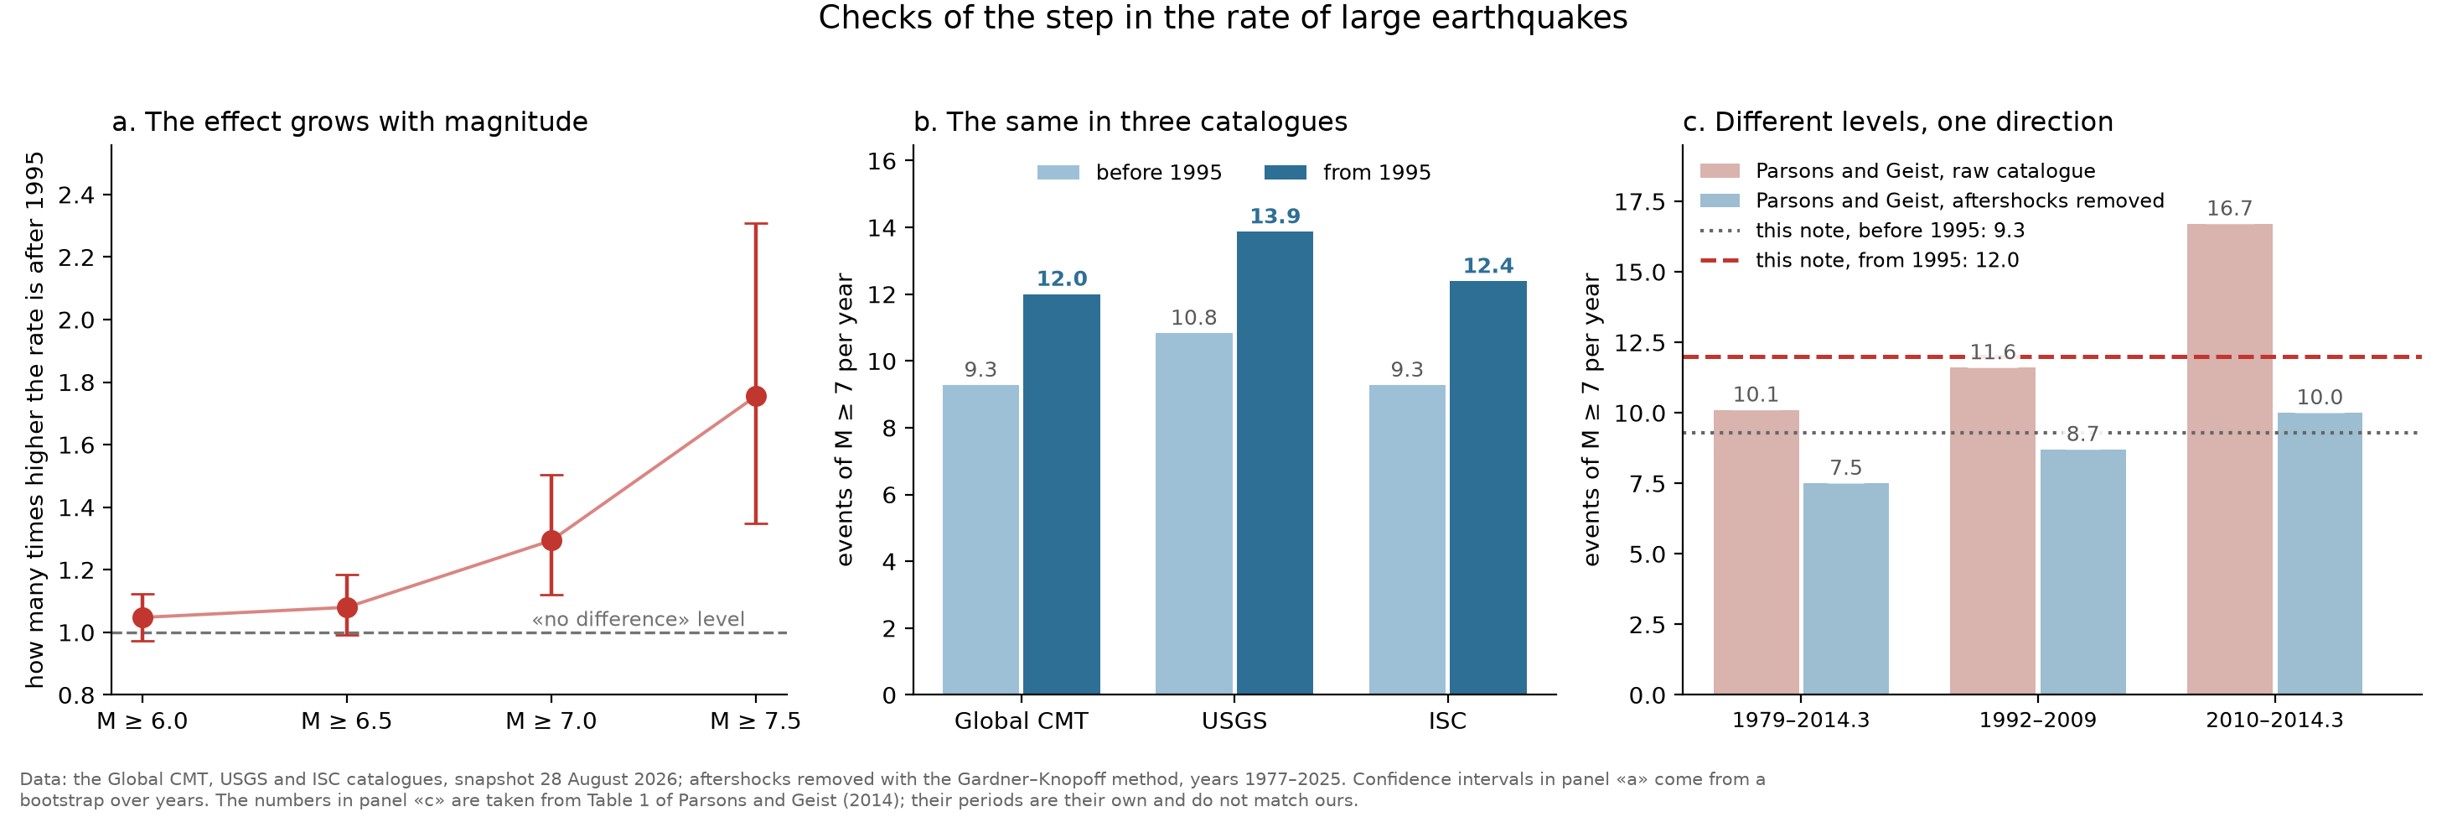
Other researchers have reported a similar pattern. In 2014, Tom Parsons and Eric Geist of the USGS published a study comparing global earthquake rates before and after removing aftershocks, a process known as declustering. For earthquakes of magnitude 7 or greater, the average rate in the raw catalog was 10.1 events per year during 1979–2014, compared with 11.6 during 1992–2009 and 16.7 during 2010–2014. After removing aftershocks, the corresponding rates were 7.5, 8.7, and 10.0 events per year [6]. While the absolute earthquake rates differ because the estimates in this article were derived using the Global CMT catalog and a different declustering method, the relative increase is comparable. Parsons and Geist’s rate of 10.0 events per year during 2010-2014 was 33% above their 1979-2014 average of 7.5, while the rate in this analysis increased by 29%, from 9.3 events per year before 1995 to 12.0 from 1995 onward (Figure 8).
A potential explanation for the increase in earthquake rates is the deployment of digital seismic networks worldwide during the 1990s, which could have led to more earthquakes being detected. For earthquakes of magnitude 7 or greater, however, this explanation is unlikely to account for the observed increase because events of this magnitude were already reliably detected by the networks of the 1980s.
The step change was then evaluated in four ways. First, the year in which the change occurred was not selected in advance. Each year from 1985 through 2015 was analyzed as a transition point, and 1995 was identified as the transition year. Statistical significance was calculated across the full search rather than for 1995 alone, and the result remained statistically significant (p = 0.029, corresponding to about a 3% likelihood of obtaining such a result by chance if the earthquake rates were actually the same). Second, even when the period of unusually large earthquakes from 2004 to 2011 was excluded, the step change remained, with the post-1995 rate approximately 27% higher than the pre-1995 rate (p = 0.005). Third, the same pre- and post-1995 comparison produced consistent results across three earthquake catalogs, with the post-1995 rate 29% higher in Global CMT, 28% higher in USGS data, and 34% higher in International Seismological Centre data. Fourth, the increase in the post-1995 rate became larger at higher magnitude thresholds. For earthquakes of magnitude 6 or greater, the post-1995 rate was only 5% higher and the difference was not statistically significant, compared with increases of 8%, 29%, and 75% at magnitude thresholds of 6.5, 7.0, and 7.5, respectively. If improved seismic monitoring were responsible for the increase, the opposite pattern would be expected because improvements in detection primarily affect weaker earthquakes.
Despite this statistical evidence, the physical interpretation of the increase remains unresolved. Andrew Michael found that the record of large earthquakes since 1900 does not provide evidence against a model in which independent earthquakes occur at a constant average rate and aftershock sequences produce periods of increased activity [7]. Peter Shearer and Philip Stark concluded that the global risk of major earthquakes has not increased in recent years [8], while Parsons and Geist found that the temporal distribution of large earthquakes differs from a random process when aftershocks are included, but not after local aftershocks are removed [6].
The conclusions of these earlier studies and the findings of this article are not contradictory because they address different questions. The earlier studies examined whether the long-term earthquake record as a whole provides sufficient evidence to rule out a constant average rate of independent earthquakes. They found that it does not. This article, however, compares the pre- and post-1995 earthquake rates and finds that the average rate of independent earthquakes is significantly higher in the post-1995 period.
Seismicity alone, however, provides an incomplete basis for assessing broader changes in Earth’s internal dynamics. A more comprehensive assessment requires consideration of multiple indicators, including magmatic and volcanic activity, geodynamic processes, and changes in Earth’s magnetic field associated with processes in the core. The step change in large-earthquake frequency since the mid-1990s therefore warrants continued study within this broader context. Possible relationships among these indicators will be examined in forthcoming studies.
Synthesis of Findings
For earthquakes of magnitude 6 or greater, seismic activity in 2026 remained close to the long-term average through August 28, with 73 independent events compared with an average of 71 during 1990-2025. Summer 2026 was notably more active. Its 567 earthquakes of magnitude 5 or greater represented the fourth-highest summer total in the 57-year record, compared with an average of 385. June initially appeared unusually active, recording 19 earthquakes of magnitude 6 or greater, but seven were aftershocks of earlier events, including four associated with the June 7 earthquake in the Philippines and three with large earthquakes from 2025. Thus, June’s unusually high total largely reflected aftershock activity rather than an exceptional number of independent earthquakes.
For earthquakes of magnitude 7 or greater, however, the number of independent events was elevated. By August 28, 11 such earthquakes had occurred, compared with an average of 8.8 by the same date during 1995–2025, a period that falls entirely within the higher rate of large earthquakes observed since the mid-1990s. Even against this higher baseline, 2026 had the sixth-highest total out of 32 years.
Beyond the number of large earthquakes, 2026 stood out in several other respects. The Venezuelan doublet on June 24 was separated by just 32 seconds, the shortest interval between two earthquakes of magnitude 7 or greater in the global catalog since 1970. In addition, the sequence produced only one aftershock of magnitude 5 or greater, compared with a median of seven for earthquakes of similar magnitude and depth. A notable geographic concentration also emerged along the northern margin of South America, where three independent earthquakes of magnitude 7 or greater occurred in 2026, compared with a long-term average of approximately one every five years; no other region showed a comparable concentration, and the result remained statistically significant after accounting for the multiple regions examined worldwide.
Thus, 2026 showed elevated large-earthquake activity even relative to the previous 30 years, a period during which earthquakes of magnitude 7 or greater have already occurred more frequently than before. Moreover, all of the anomalies identified in 2026 involved earthquakes of magnitude 7 or greater. Their number was elevated, one pair occurred only 32 seconds apart and produced unusually few aftershocks, and three occurred within a region where more than one such earthquake had never been recorded in a single year during 56 years of observations. These observations warrant further investigation into whether they reflect a broader shift in the regime of large-earthquake seismicity, including comparison with other indicators of Earth’s internal dynamics.
These findings leave several important questions unresolved. Why were the two Venezuelan earthquakes on June 24 separated by only 32 seconds, and did they represent one or two ruptures? Why did the sequence produce only one aftershock of magnitude 5 or greater, compared with a median of seven for similar earthquakes? Could there be a physical connection among the three large earthquakes along the northern margin of South America despite their different fault systems, depths, and rupture mechanisms? More broadly, what changed in the mid-1990s, when earthquakes of magnitude 7 or greater began occurring about 30% more frequently worldwide, and why has this higher rate persisted for three decades? Answering these questions requires looking beyond seismicity alone to other indicators of Earth’s internal dynamics.
Practical Implications
The authors are not in a position to assess earthquake risk for a particular city, building, or individual; location-specific risk assessments should be based on information and guidance from national and local geological surveys and emergency management agencies. Residents should therefore follow guidance from local authorities, which can account for local seismic hazards and established emergency procedures in ways that general recommendations cannot. If local authorities recommend keeping an emergency kit ready, residents should prepare one according to that guidance.
Earthquake losses depend not only on magnitude but also on vulnerability, including the condition of buildings, soil properties, population density, and the preparedness of emergency services. Unlike the earthquake itself, vulnerability can be reduced through preparation. Earthquakes of magnitude 7.5 occur several times a year worldwide and do not necessarily result in thousands of deaths.
From a scientific perspective, improving our understanding of global seismicity requires high-quality observations, including dense seismic station networks, reliable long-term records, open access to data, and continued reanalysis of historical earthquake catalogs. Because 2026 is not yet complete, it remains uncertain whether seismic activity during the rest of the year will reinforce or alter the patterns identified in this analysis.
Methods
The analysis used data from global seismic catalogs accessed on August 28, 2026. The primary source was the USGS ANSS Comprehensive Earthquake Catalog (ComCat) [9]. Only records present in the catalog on the access date were included; deleted records and merged solutions were excluded. Results were cross-checked against the Global CMT catalog, which provides earthquake magnitudes on a consistent moment magnitude scale [10]. Aftershocks were identified and removed using the Gardner–Knopoff method [1]. When two events had the same magnitude, the later event was classified as the aftershock. To avoid comparing the incomplete 2026 record with complete calendar years, historical comparisons were restricted to January 1 through August 28 of each year. Focal mechanisms were classified based on the plunge angles of the P, T, and N axes according to Frohlich’s scheme [11]. The long-term series used to compare earthquake rates before and after 1995 begins in 1977, the first complete year of Global CMT data used in this analysis. For the regional analysis, the area along the northern margin of South America was defined as 0-16° N and 82-58° W. For reproducibility, the earthquake samples used in the analyses were retained together with the catalog access date.
Sources
- Gardner J. K., Knopoff L. “Is the Sequence of Earthquakes in Southern California, with Aftershocks Removed, Poissonian?” Bulletin of the Seismological Society of America 64 (1974): 1363–1367. https://doi.org/10.1785/BSSA0640051363
- Di Giacomo D., Bondár I., Storchak D. A., et al. “ISC-GEM: Global Instrumental Earthquake Catalogue (1900–2009), III. Re-computed MS and mb, Proxy MW, Final Magnitude Composition and Completeness Assessment.” Physics of the Earth and Planetary Interiors 239 (2015): 33–47. https://doi.org/10.1016/j.pepi.2014.06.005
- Ahn J., Lešková A. “Thirty-Nine Seconds: Insights from the 2026 Venezuela Earthquake.” ALLATRA Natural Science Review 1 (2026): 34–44. https://allatra.org/global-research-center/journal/volume1
- Båth M. “Lateral Inhomogeneities of the Upper Mantle.” Tectonophysics 2 (1965): 483–514. https://doi.org/10.1016/0040-1951(65)90003-X
- Servicio Geológico Colombiano. Statement that the August 10, 2026, earthquake in Colombia was unrelated to the June 24, 2026, events in Venezuela. Post on the official account of the service, August 10, 2026. https://x.com/sgcol/status/2086966489232384451
- Parsons T., Geist E. L. “The 2010–2014.3 Global Earthquake Rate Increase.” Geophysical Research Letters 41 (2014): 4479–4485. https://doi.org/10.1002/2014GL060513
- Michael A. J. “Random Variability Explains Apparent Global Clustering of Large Earthquakes.” Geophysical Research Letters 38 (2011): L21301. https://doi.org/10.1029/2011GL049443
- Shearer P. M., Stark P. B. “Global Risk of Big Earthquakes Has Not Recently Increased.” Proceedings of the National Academy of Sciences 109 (2012): 717–721. https://doi.org/10.1073/pnas.1118525109
- U.S. Geological Survey. ANSS Comprehensive Earthquake Catalog (ComCat). https://earthquake.usgs.gov/data/comcat/
- Ekström G., Nettles M., Dziewoński A. M. “The Global CMT Project 2004–2010: Centroid-Moment Tensors for 13,017 Earthquakes.” Physics of the Earth and Planetary Interiors 200–201 (2012): 1–9. https://doi.org/10.1016/j.pepi.2012.04.002
- Frohlich C. “Triangle Diagrams: Ternary Graphs to Display Similarity and Diversity of Earthquake Focal Mechanisms.” Physics of the Earth and Planetary Interiors 75 (1992): 193–198. https://doi.org/10.1016/0031-9201(92)90130-N
Ahn, J., and N. Albridge. Seismicity in Summer 2026: Normal Patterns, Anomalies, and Open Questions. Analytical Brief. ALLATRA Global Research Center, ALLATRA Inc., 2026. https://doi.org/10.65849/agrc.brief.seis.2026.10002